Search

Visualizing Filming Locations with the TomTom Maps SDK for Web

Converting a data set with location information into a visual representation of the data used to be a task for specialized software. TomTom location services and the TomTom Maps SDK for Web make it easy for programmers to create location-aware visualizations.

In this tutorial we’ll walk through an application that uses a public data set of film locations in New York City to display these locations and information about them on a map. The same technique could be used to display data from a variety of public or proprietary data sets. In this tutorial you will do the following:

  • Read information and location data from a public or proprietary data set.
  • Create a map marker and popup to display information for each valid data point.
  • Use TomTom location services to geocode locations that are missing lat/long coordinates.

Creating your map

To get started, you’ll need the following:

Download and unzip the TomTom Maps for SDK Web Standalone functional example.

Next, download the XML file from Filming Locations (Scenes from the City), then save this XML file into a new directory called data in the root directory of your unzipped Standalone function example files.

Create a new file called nyc-movie-locations.html that contains the following web page markup, then save this new file beside the existing index.html file into the root directory of your unzipped Standalone function example files.

				
					<!DOCTYPE html>
	<html class='use-all-space'>
	<head>
    	<meta http-equiv='X-UA-Compatible' content='IE=Edge' />
    	<meta charset='UTF-8'>
    	<title>My Map</title>
    	<meta name='viewport' content='width=device-width,initial-scale=1,maximum-scale=1,user-scalable=no'/>
    	<link rel='stylesheet' type='text/css' href='./sdk/maps.css'/>
    	<link rel="shortcut icon" href="/favicon.png">
    	<link rel="apple-touch-icon" href="/favicon.png">
    	<script src='./sdk/maps-web.min.js'></script>
    	<script src='./sdk/services-web.min.js'></script>
    	<script src='https://code.jquery.com/jquery-3.4.1.min.js'></script>
    	<style>
    	#map {
        	width: 100vw;
        	height: 100vh;
    	}
    	</style>
	</head>
	<body>
    	<div id='map' class='map'></div>
    	<script>
        	// Coordinates of New York City - offset a little to centre the map
        	var startPoint = [[-74.0060 - 0.01, 40.7128 + 0.01]];
        	
        	// enter your own API key here
        	var yourKey = '<your-tomtom-API-Key>';
 
        	// create a map, centered and zoomed
        	tt.setProductInfo('<your-product-name>', '<your-product-version>');
        	var map= tt.map({
                            	key: yourKey,
                            	container: 'map',
                            	zoom: 10.7,
                            	center: startPoint[0],
                            	style: 'tomtom://vector/1/basic-main'
                        	});
 
	        // add some controls
        	map.addControl(new tt.FullscreenControl());
        	map.addControl(new tt.NavigationControl());
 
        	// setup popup boundaries
        	var markerHeight = 50, markerRadius = 10, linearOffset = 25;
        	var popupOffsets = {
            	'top': [0, 0],
            	'top-left': [0,0],
            	'top-right': [0,0],
            	'bottom': [0, -markerHeight],
            	'bottom-left': [linearOffset, (markerHeight - markerRadius + linearOffset) * -1],
            	'bottom-right': [-linearOffset, (markerHeight - markerRadius + linearOffset) * -1],
            	'left': [markerRadius, (markerHeight - markerRadius) * -1],
            	'right': [-markerRadius, (markerHeight - markerRadius) * -1]
        	};
 
        	// extract data from a given row and column of data source
        	function extractData(source, row, column, tab){
            	// alter location to extract data depending on tab of spreadsheet
            	var result = (tab==1) ? source.querySelector("Workbook > Worksheet:nth-child(5) > Table > Row:nth-child(" + row + ") > Cell:nth-child("+column+") > Data")
                                	: source.querySelector("Workbook > Worksheet:nth-child(7) > Table > Row:nth-child(" + row + ") > Cell:nth-child("+column+") > Data");
            	// get innerHTML if a valid result, if valid, clean up data here.
            	return result == null ? "" : result.innerHTML.trim().replace('n/a','').replace('N/A','');
        	}
 
        	function createMarkerAndPopup(source, row, tab){
            	// cater for two different formats for tab 1 vs tab 3
            	var col = (tab==1)? [1,2, 6,7,8,9,10,11,12,13,14,15,16]  // tab 1
                            	: [1,2,21,5,6,7, 8, 9,10,11,12,13,14]; // tab 3
 
            	var Film = extractData(source,row,col[0],tab);
            	var Year = extractData(source,row,col[1],tab);
            	var Artist_Credit = extractData(source,row,col[2],tab);
            	var Director_Filmmaker_Name = extractData(source,row,col[3],tab);
            	var Director_Filmmaker_IMDB_Link = extractData(source,row,col[4],tab);
            	var Location_Display_Text = extractData(source,row,col[5],tab);
            	var LATITUDE = extractData(source,row,col[6],tab);
            	var LONGITUDE = extractData(source,row,col[7],tab);
            	var Borough = extractData(source,row,col[8],tab);
            	var Neighborhood = extractData(source,row,col[9],tab);
            	var Scene_Type = extractData(source,row,col[10],tab);
            	var Media = extractData(source,row,col[11],tab);
            	var IMDB_LINK = extractData(source,row,col[12],tab);
 
            	if (tab==3){
                	// build a location to geocode
                	var loc = (Location_Display_Text + ' ' + Borough + ' ' + Neighborhood).trim();
                	// don't try to geocode blank entries
                	if(loc!='') {
                    	$.get( "https://api.tomtom.com/search/2/geocode/"+
                                	loc.trim()+
                                	".xml?typeahead=false&limit=1&countrySet=US&lat=40.7128&lon=-74.0060&radius=10000&topLeft=41%2C-174&btmRight=40%2C-73.5&key="+
                                	yourKey, function(data,status){
                        	// only grab results when successful
                        	if(status=='success'){
                            	var results = data.querySelector("response > summary > numResults");
                            	if (results != null && results.innerHTML == '1'){
                                	LATITUDE = data.querySelector("response > results > item > position > lat").innerHTML;
                                	LONGITUDE = data.querySelector("response > results > item > position > lon").innerHTML;
                                	console.log(loc+' Geocoded result: '+LATITUDE+ ','+LONGITUDE);
                            	}
                        	}
                    	});
                	}
            	}
 
            	// only show data
            	if (!isNaN(LATITUDE) && !isNaN(LONGITUDE)){
                	// coordinate for the map marker
                	var state = {
                        	center: {
                            	lat:  LATITUDE,
                            	lng: LONGITUDE
                        	},
                        	coordinates: null,
                        	selectedAddress: null
                    	};
 
                	// HTML content for the popup
                	var html = "<table>" +
                            	"<tr><th>" + Media + "</th><td><a href='" + IMDB_LINK +"' target='_blank'>" + Film + "</a></td></tr>"+
                            	"<tr><th>Year</th><td>" + Year + "</td></tr>" +
                            	"<tr><th nowrap>" + Artist_Credit + "</th>" +
                            	"<td><a href='" + Director_Filmmaker_IMDB_Link + "' target='_blank'>" + Director_Filmmaker_Name + "</a></td></tr>"+
                            	"<tr><th>Location</th><td>" + Location_Display_Text.replace("&amp;", "&")
                                                                                    .replace("&lt;br&gt;", ", ")
                                                                                    .replace("&lt;br&gt;", ", ") + "</td></tr>" +
                            	(Scene_Type != "" ? "<tr><th>Scene</th><td>" + Scene_Type + "</td></tr>" : "") +
         	                   "</table>";
 
                	// create a popup
                	var popup = new tt.Popup({offset: popupOffsets, className: 'my-class'})
                        	.setLngLat(state.center)
                        	.setHTML(html)
                	.addTo(map);
 
                	// create a map marker and link to the popup
                	var marker = new tt.Marker()
                	.setLngLat(state.center)
                	.setPopup(popup)
                	.addTo(map);
            	}
        	}
 
        	// read the XML data file, extract the data and create a marker+popup for each location
        	$.get("data/Interactive_Map_Data.xml", function (xml) {
            	// console.log(xml);
 
            	// read from 1st spreadsheet tab (231 rows)
            	for (var i=22;i<254;i++) {
                	createMarkerAndPopup(xml, i, 1);
            	}
            	// read from 3rd spreadsheet tab (7 rows)
            	for (var i=6;i<14;i++) {
                	createMarkerAndPopup(xml, i, 3);
            	}
        	});  	
    	</script>
	</body>
	</html>  


Here you’ll need your own free API key.

If you haven’t got one yet just follow the steps Create your API Key now at this tutorial.

Next edit your map file nyc-movie-locations.html to include your own API key (in var yourKey = ‘<your-tomtom-API-Key>’;), as well as an application name and application version.

Finally, to be able to view the new map we’ll run a simple HTTP server. Navigate to the directory containing the example.

We’re going to install a light-weight Node.js http-server (note that you might need to run this command with admin/root privileges):

				
					npm install --global http-server


Then just simply run the following command to start the server:

				
					http-server


Now you can view your map page by pointing your browser to URL http://localhost:8080/nyc-movie-locations.html 

Here it is:

blog-1

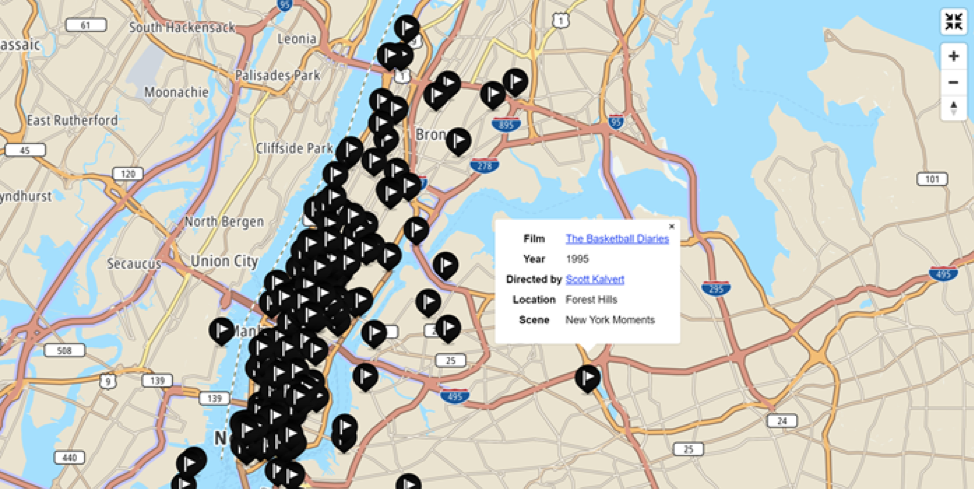
Click on a map marker to view the popup information. Click on a movie or director link to view more information from IMDB in another window. You can use the zoom or full screen controls, or mouse zoom/drag to navigate as required.

Reviewing The Data Source

Thinking of creating similar applications for yourself?  Here’s a few tips to help you see if a given data source is suitable, as well as some background information on how this particular data set was analyzed and used here.

The dataset Filming Locations (Scenes from the City) happens to be a spreadsheet saved as XML. Almost any data source could be used including JSON, plain text, CSV, XML, data objects from a database, or an API call.

The important thing is that each data point includes the relevant information you want to map and some sort of location information — ideally latitude and longitude coordinates or at least an address, even if just a suburb or city.

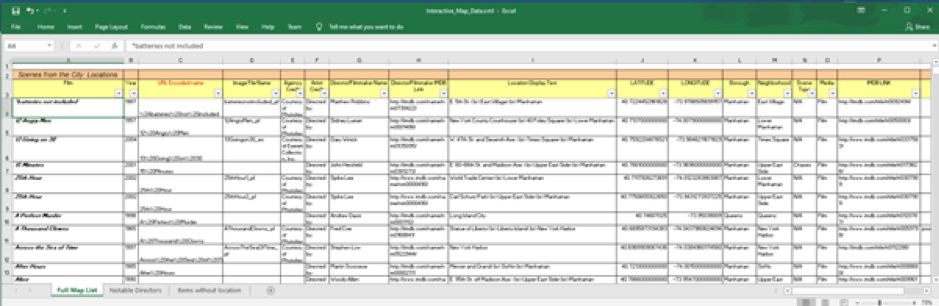
The data source used for this application happens to have all of this. Here’s the first few rows in the first tab of the spreadsheet, as viewed from Excel:

Blog-2

You could also view the XML in a text editor, and this might be all you need if it is a straightforward XML file.

If your data source is missing latitude and longitude information, but includes street address or suburb/place name information, then it is possible to use geocoding, a process where the location is converted to a latitude and longitude, to create the necessary latitude and longitude coordinates for mapping the data points.

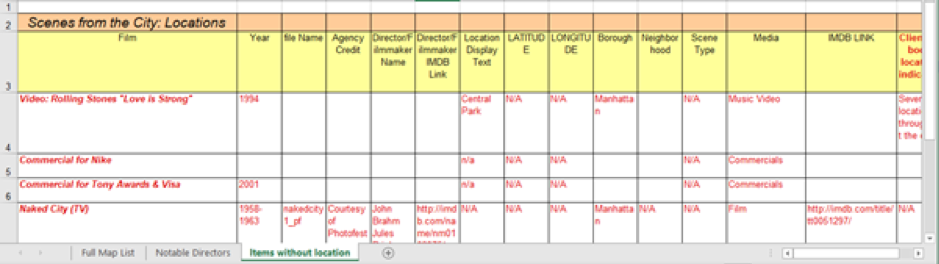
Notice the third tab of the spreadsheet called “Items without location”, here’s an example of data entries without latitude and longitude information. Later in the tutorial we’ll see how we can use geocoding services, which are a part of TomTom location services, to make this data usable as well.

This following ‘trick’ can help make analysis and extraction of any data source, documented or not, much easier.

Inside the nyc-movie-locations.html page where we read the XML block, just uncomment the console.log line, then comment out the remaining code in the block, leaving just the console.log statement active as shown below:

				
					$.get("data/Interactive_Map_Data.xml", function (xml) {
            	console.log(xml);
            	// // read from 1st spreadsheet tab (231 rows)
            	// for (var i=22;i<254;i++) {
            	// 	createMarkerAndPopup(xml, i, 1);
            	// }
            	// // read from 3rd spreadsheet tab (7 rows)
            	// for (var i=6;i<14;i++) {
            	// 	createMarkerAndPopup(xml, i, 3);
            	// }
        	});


Save your changes, then view your map page at URL http://localhost:8080/nyc-movie-locations.html. We’ll use the Chrome browser’s debug mode to help us explore the data in the XML file (or other data source) and this in turn will help us see how the data is structured as well as help us extract the information we need to create our map. Most browsers include developer console features similar to the example shown here, but the specific commands and display details may differ.

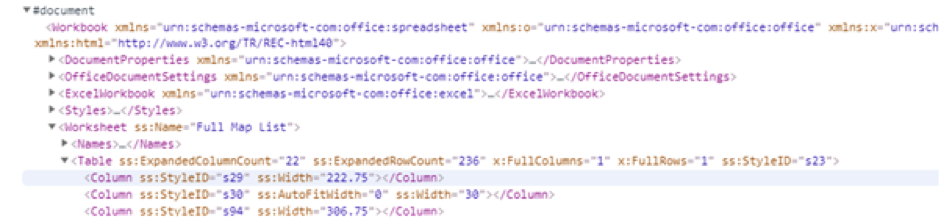
In Chrome, press F12 to enter debug mode, then select the Console tab of the Chrome debugger. Refresh the page and look for an entry in the Console called #document; it should look like this:

blog-4

This is the XML data we’ve just read and now logged to the console. Click on the > symbol left of #document to expand the dump of this XML data source.

The debugger allows us to drill down through the various elements of the XML file to explore the structure and find our data points. The first sections contain styles, column names, and then later the actual data we wish to use.

After you expand #document further sections appear. Expand Worksheet where it has the attribute ss_Name=”Full Map List”; this corresponds to the first worksheet tab in Excel.

blog-5

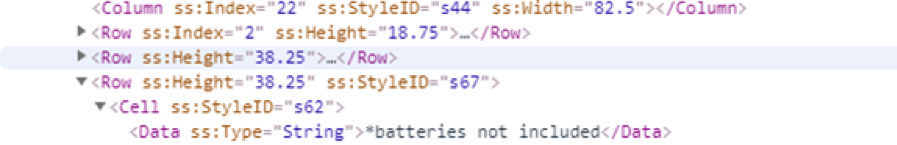
Expand the Table element, then scroll down past the Column elements to the Row elements, expand the third Row element, then expand the first Cell element and finally expand the Data element inside:

blog-6

Right click the Data element and navigate through Chrome’s debug menu to Copy > Copy Selector:

Blog-8

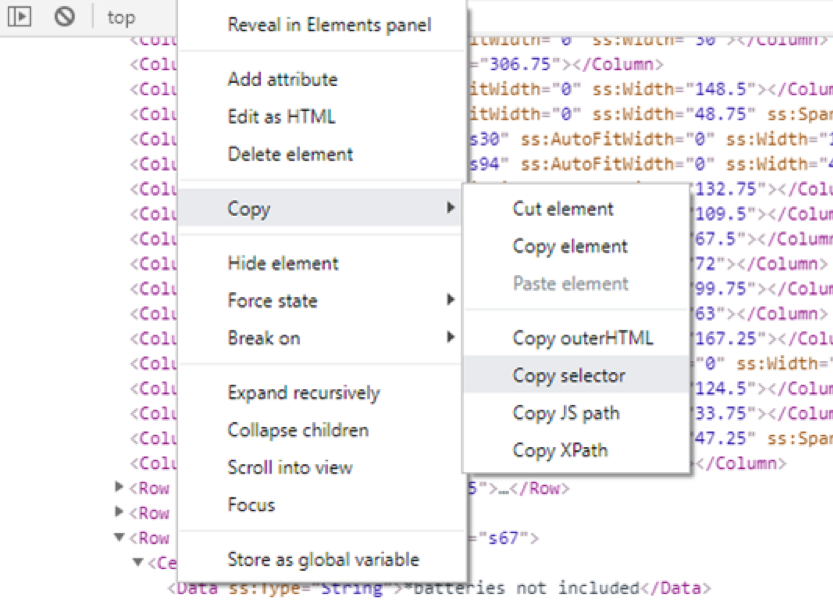
This is a quick way to generate the code needed to extract a particular piece of data from inside an XML document.

In the case above, the first movie title given by the selector is:

				
					Workbook > Worksheet:nth-child(5) > Table > Row:nth-child(22) > Cell:nth-child(1) > Data


Although the process of discovering the location of your data would be easier with good documentation or a data source you have created yourself, even moderately complex XML data such as this data set can be navigated with very little effort.

Geocoding Address Data

Now what about the third tab of the spreadsheet that was missing latitude and longitude data?

Geocoding allows us to take an address (street number, street name, and so on), or simply a place name and country, and then find the latitude and longitude of that location. Obviously, you will have better quality results if you can access a more complete address, but fortunately the TomTom Search API Geocoding endpoint is very forgiving of partial addresses and even poor typing.

For our NYC Film Locations application, the third tab has no latitude and longitude data. Instead, most rows have a mixture of filming locations, borough, and neighborhood entries. The third tab’s column ordering is a little different from the first, so we’ll use a simple lookup table, stored in an array, to vary which spreadsheet columns are copied into our final data depending on the spreadsheet tab being read at the time.

Here’s an excerpt of the code responsible for geocoding data. If we are reading data from the third tab, then we’ll build up a text string of the location, using as much address information as we can. We call the TomTom search API Geocoding endpoint and, if we get the single result requested, we’ll extract a latitude and longitude.

				
					if (tab==3){
  // build a location to geocode
  var loc = (Location_Display_Text + ' ' + Borough + ' ' + 
    Neighborhood).trim();
  // don't try to geocode blank entries
  if(loc!='') {
    $.get( "https://api.tomtom.com/search/2/geocode/"+ loc.trim()+                          ".xml?typeahead=false&limit=1&countrySet=US&lat=40.7128&lon=-74.0060&radius=10000&topLeft=41%2C-174&btmRight=40%2C-73.5&key="+
      yourKey, function(data,status){
      	  // only grab results when successful
        if(status=='success'){
          var results = data.querySelector(
            "response > summary > numResults");
          if (results != null && results.innerHTML == '1'){
            LATITUDE = data.querySelector(
              "response > results > item > position > lat").innerHTML;
            LONGITUDE = data.querySelector(
              "response > results > item > position > lon").innerHTML;
            console.log(loc+' Geocoded result: '+LATITUDE+ ','+LONGITUDE);
          }
        }
      });
  }


To see only geocoded data, just comment out the loop of data from the first tab and leave the loop around the data from the third tab.

Conclusion

In this tutorial we’ve found out how to analyze an XML data file as well as how to extract location data and other information from our data source. We also saw how to display this data as map-markers and popups on a map and how to geocode data when we are supplied with geographical coordinates.

Where next? Try using these same techniques to map data for your company, community or other uses.

You could also enhance your map to include a grand tour of selected New York Movie locations, complete with traffic flow and routing.  Many features are demonstrated in the sample files included with Tom Tom Maps for SDK Web Standalone functional example that you downloaded to build this application. Just look in the pagesexampleshtml folder of the unzipped files and you’ll find dozens of functional samples full of great ideas.  To get them running, just edit them and add a copy of your free API key.

This article was originally published on TomTom’s blog.

If you’re interested in developing expert technical content that performs, let’s have a conversation today.

Facebook
Twitter
LinkedIn
Reddit
Email

POST INFORMATION

If you work in a tech space and aren’t sure if we cover you, hit the button below to get in touch with us. Tell us a little about your content goals or your project, and we’ll reach back within 2 business days. 

Share via
Copy link
Powered by Social Snap