There are several ways we can represent and document systems and processes. Looking at a system in different ways increases the understanding of that system.
This article looks at two ways of representing systems using diagrams: UML deployment diagrams, and entity-relationship diagrams. We’ll start by defining these diagrams, and then go on to discuss their similarities and differences using examples.
UML Deployment Diagrams
A UML deployment diagram is a UML diagram that shows the execution architecture. Execution architecture includes nodes such as hardware and software environments, the middleware connecting them, the links of communication, and the placement of files on the hardware. This helps visualize how we have deployed or how we intend to deploy the software on the hardware.
The most commonly used components of UML deployment diagrams are:
- Nodes
- Artifacts
- Communication path
- Devices
- Deployment specifications
Let’s define each and see how to represent them in a diagram.
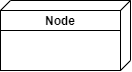
Nodes
A node is a physical entity. It could be a hardware or software element that executes one or more components, subsystems, or executables. It’s also known as a deployment target.
Artifacts
An artifact is an element that represents some physical entity. A development process produces it. Examples of artifacts are scripts, libraries, executable files, and configuration files.
![]()
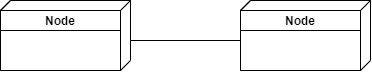
Communication Path
A communication path is a channel between two deployment targets, through which they can exchange signals and messages. It represents the communication path between the two nodes with a solid line.
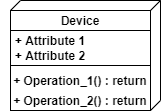
Devices
A device is a node that represents a physical computational resource in a system, one with processing capability to which we deploy artifacts for execution. Examples include mobile devices or application servers.
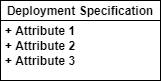
Deployment Specification
A deployment specification is an artifact. One example is a text file or an XML document that specifies how to deploy an artifact on a node.
Entity-Relationship Diagrams
An entity-relationship diagram (ERD) is a type of flowchart that, as its name suggests, illustrates the relationships of entities stored in a database. An entity is an object, a component of data, that contains attributes that define its properties. It represents the storage of data in the database. A collection of similar entities is an entity set. ERDs sketch out, model, and design relational databases in logic and business rules. An ERD illustrates the logical structure of a database by defining the entities and their attributes, and showing the relationships between them.
The five main components of an ERD are:
- Entities
- Actions
- Attributes
- Connecting lines
- Cardinality
Let’s look at each of these in detail.
Entities
As we’ve seen, entities represent the data to be stored. We can think of an entity as a noun: a person, place, or thing. An entity represents a database table.

An entity that isn’t defined entirely by its own entities is called a weak entity. A foreign key relationship with another entity needs to specify the value of the key.

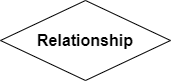
Actions
An action, known as a relationship, shows how entities act upon each other and share information in the database. They represent the relationship between two entities.
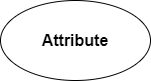
Attributes
An attribute is a property or characteristic of an entity. The entity’s attributes are fields in a database table. A key attribute is a uniquely distinguishing characteristic of an entity.
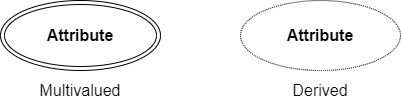
Multivalued attributes can have more than a single value. A derived attribute is one whose value we calculate from another. For example, we can derive an average course rating from the sum of ratings divided by the number of ratings. Derived attributes shouldn’t exist in the database — only their source attributes should.
Connecting Lines
Connecting lines are solid lines that connect attributes to show the relationships of entities in the database.
Cardinality
Cardinality is the specification of how many instances of an entity are related to another entity or entity set. Here are examples of the three primary cardinal relationships:
- One-to-one: one student can have one desk
- One-to-many: one student can register for many courses
- Many-to-many: many students can have many teachers

Differences and Similarities
From what we’ve discussed, the most obvious difference is the different levels at which we use these two diagrams.
UML deployment diagrams provide an overall picture of the system, show the relationship between the various physical components within the system, and model the system’s runtime architecture. They describe the hardware components that we use to deploy the software components.
ERDs, on the other hand, describe and visually present database entities and how these entities are related to one another. So, they help to explain the logical structure of the database. A UML deployment diagram assists with designing a system, and an ERD helps to design the database.
When to Use UML Deployment Diagrams and Entity Relationship Diagrams
Using UML Deployment Diagrams
Developers, DevOps engineers, system administrators, and network engineers use UML deployment diagrams. They tend to differ based on who uses them and how people think diagrams help them create systems. The primary purpose of these diagrams is to show the installation of software on the hardware and to show how the software interacts with the hardware to execute. Showing this is important because software applications are complex. We can have standalone, web-based, or distributed systems, to name a few. Or we can have a combination of these.
We can use UML deployment diagrams for:
- Modeling the hardware topology of a system
- Modeling hardware details for a client and server system
- Modeling the hardware details of a system
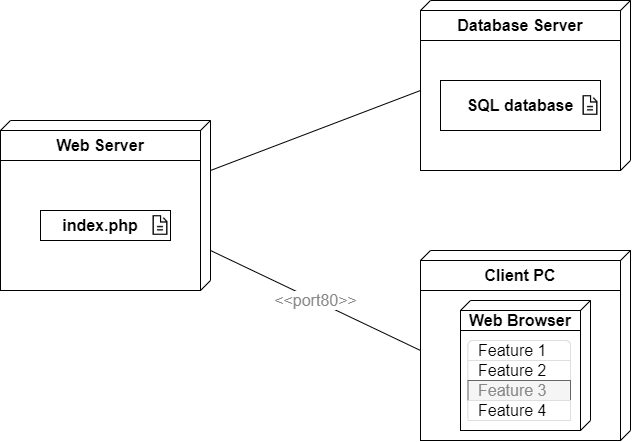
Let’s look at an example of a deployment diagram that represents how we can deploy feature flags. Feature flagging is a technique that enables the modification of system behavior without changing code. It enables us to turn functionality on and off during runtime.
We can deploy these feature flags using a configuration file that stores global application settings. But suppose we have many flags or need more granular control of our application. In that case, we can deploy flags using a database to target individual users.
Now, let’s look at a deployment diagram using a database. Notice how the deployment diagram doesn’t focus on the logical components of the system but instead draws attention to the hardware topology.
Using ERDs
Entity-relationship diagrams are handy for businesses with complex databases. Analysts and developers use them to define and analyze how data is set up in a particular system. They can be a great way to communicate the business landscape to different teams. Because ERDs graphically represent data, it makes it easier for business people to understand.
We can use ERDs for:
- Gathering requirements
- Designing, maintaining, and modifying a database
- Communicating data requirements
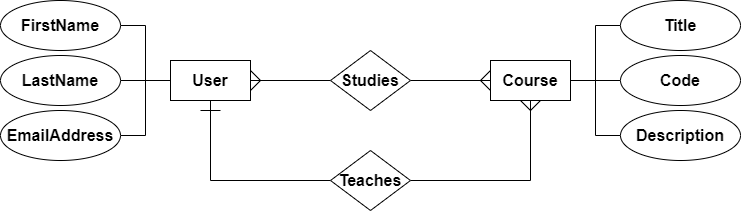
The following is an example of a simple ERD representing a course enrolment system. It shows the models with their attributes and their relationship with each other. The diagram indicates that many users can study many courses, and one teacher can teach many courses.
Conclusion
This article discussed UML deployment diagrams and entity-relationship diagrams. The main difference between the two is that we use UML deployment diagrams to model a system’s hardware and its interaction with the software deployed on it. In contrast, we use ERDs to model databases and the relationship of their entities. Understanding this makes it easy to choose the right tools.
For more examples of ULM deployment diagrams, see Entity Relationship Modeling Examples, and for more elaborate examples of ERDs, visit UML Deployment Diagrams Examples. To learn more about feature flags, visit LaunchDarkly.
If you’re interested in developing expert technical content that performs, let’s have a conversation today.