People make many important decisions based on data. But analyzing increasingly larger amounts of data is challenging. Tableau provides a platform to visualize data using charts, graphs, and other views. And, MuleSoft’s Anypoint platform can develop workflows that act on the data. When combined, Tableau and MuleSoft allow you to create a Tableau dashboard extension that seamlessly acts on your data without leaving your visualization workflow. Once you’ve created a MuleSoft API and deployed it using CloudHub or your HTTPS endpoint, you can call it from your extension using JavaScript, and display the results on a dashboard.
This tutorial shows you to create a simple extension and API, focusing on integration. But, you can extend your JavaScript code to take advantage of the additional features of the dashboard extensions API and write more complex communications with a more powerful MuleSoft API.
Tableau and MuleSoft
Tableau offers a visualization engine that helps you grasp and extract insights from your data. A key component of Tableau is our workbooks. Much like spreadsheet workbooks, these consist of multiple sheets, each of which can be a different type.
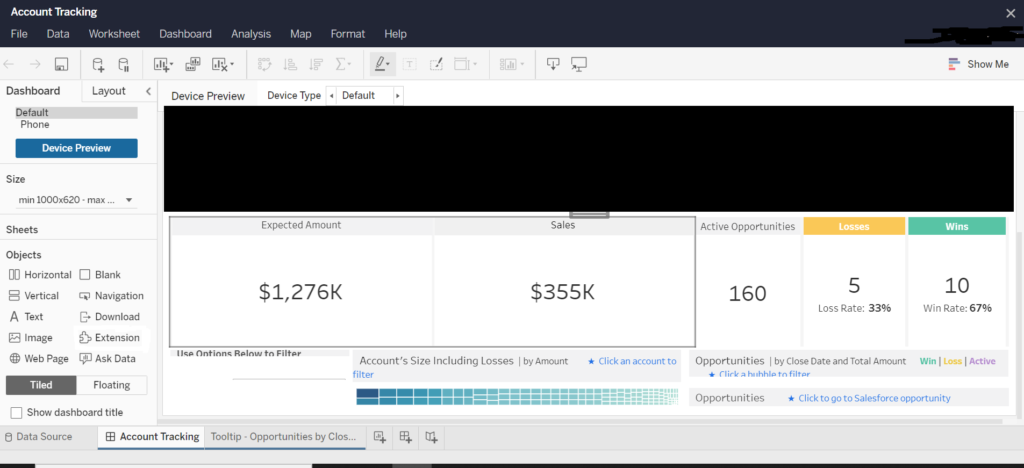
Log on to your Tableau site and create a workbook.
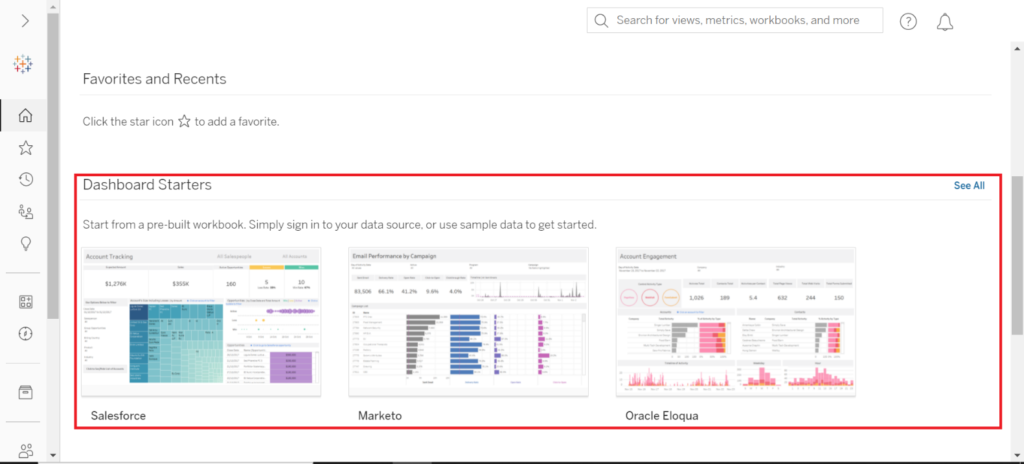
Once you’ve opened your starter workbook, look around. There are several components on the dashboard already. You add your extension as another component.
Although Tableau provides analytical tools that provide a deep understanding of data, you may want to analyze the data yourself. This often requires disruption of your workflow when using a separate tool. However, Tableau dashboard extensions let you integrate another tool, like a MuleSoft API, into your dashboard. You can start a workflow right from your dashboard. MuleSoft processes the data using the API you created, and your extension’s script displays the results.
Creating a MuleSoft Workflow
Create your backend API first by creating an API that returns an average of a list of numbers. Download Anypoint Studio and follow the additional set up instructions for your platform. Sign up for a free trial. Create an account as well because you need that to use Anypoint Studio.
- Open the app once you’ve installed it and create a new Mule project by right-clicking inside Package Explorer. Select New > Mule Project.
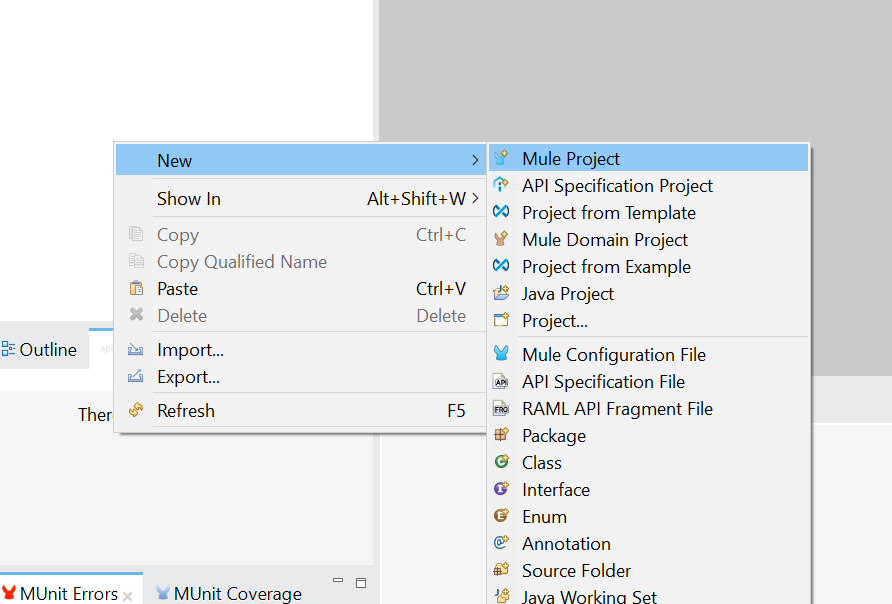
A wizard appears.
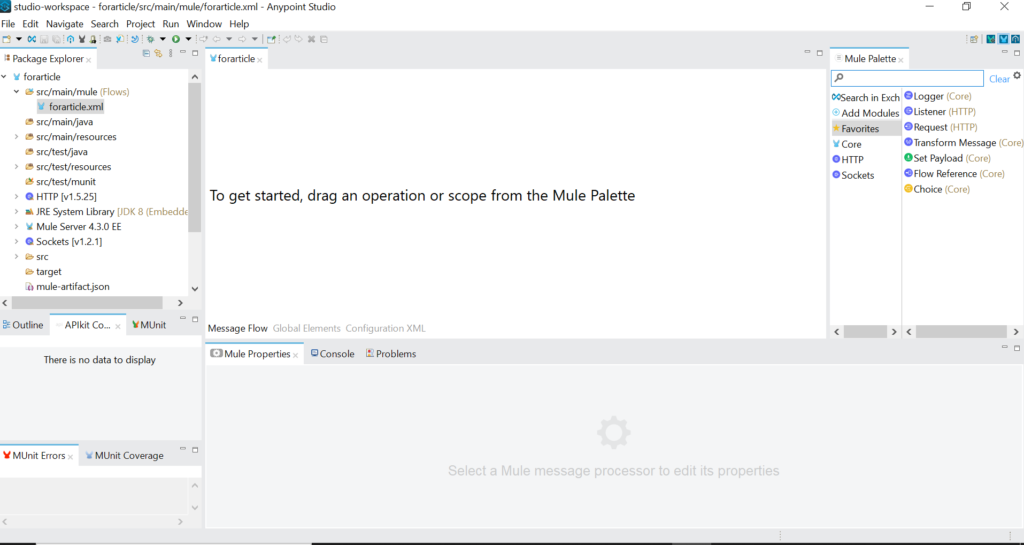
- Type in a name for your project and keep the default settings for everything else. Then click Finish. Once the Mule palette has opened, your screen looks like this:
- Drag a Listener module from the palette on the right. Anypoint Studio creates a flow that begins with the module you just dragged over.
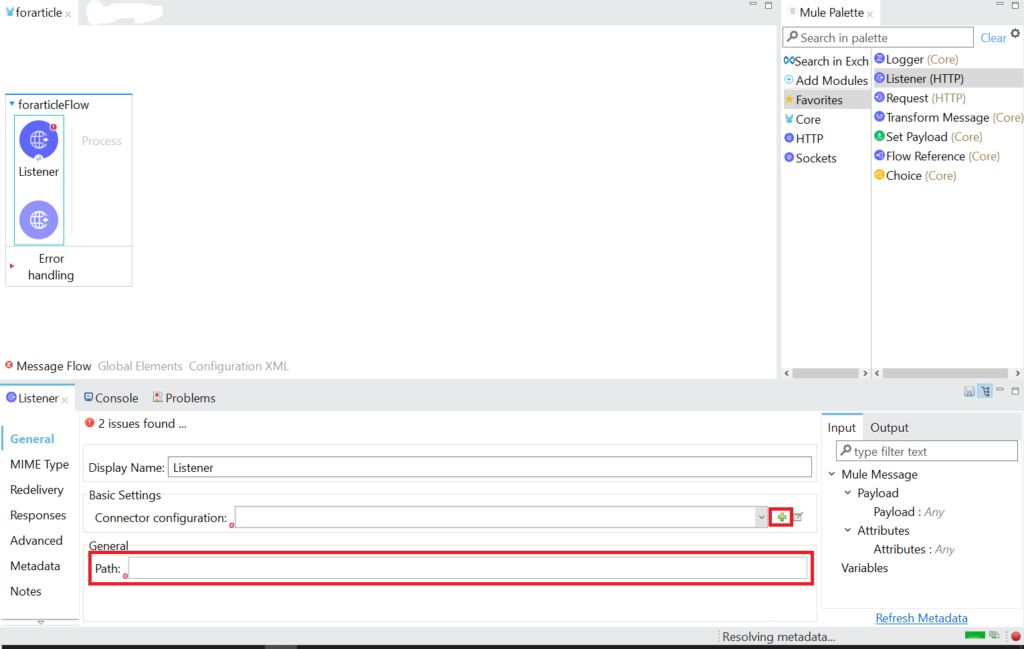
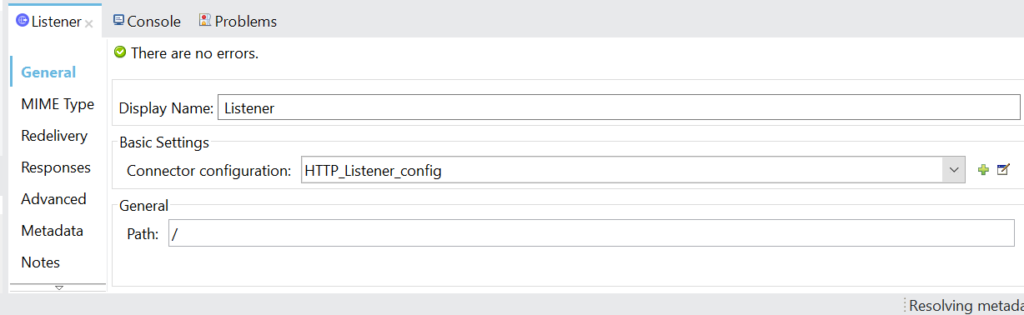
- Click the Listener module to reveal the properties at the bottom. You must set the connector configuration and the path on which your service listens for requests. Configure the connector first by clicking the green plus button. A dialog box to set up your listener appears.
- Leave the default settings and click OK.
- Now, set a path in the Properties panel, as shown below. Set the value of the path field to “/” so that the service doesn’t take any REST parameters.
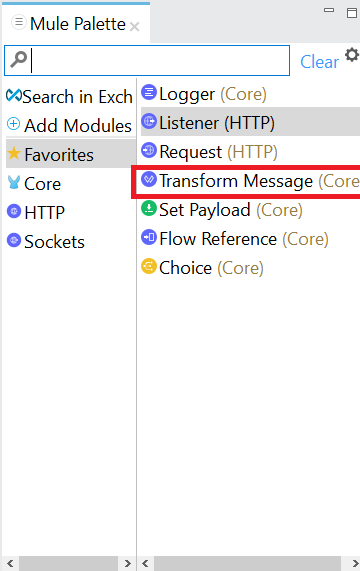
Now that you’ve configured your Listener, add a Transform Message component. This component processes the input from the REST API and generates a JSON response.
Adding a Transform Message component
- Drag the Transform Message component from the palette on the right to the right of your Listener.
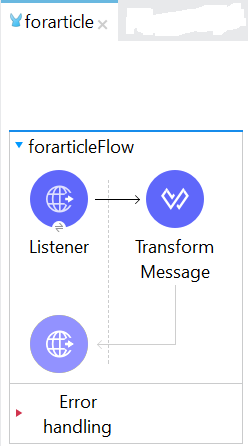
After dragging it over to the right of your Listener and letting it snap into place, your flow looks like the following:
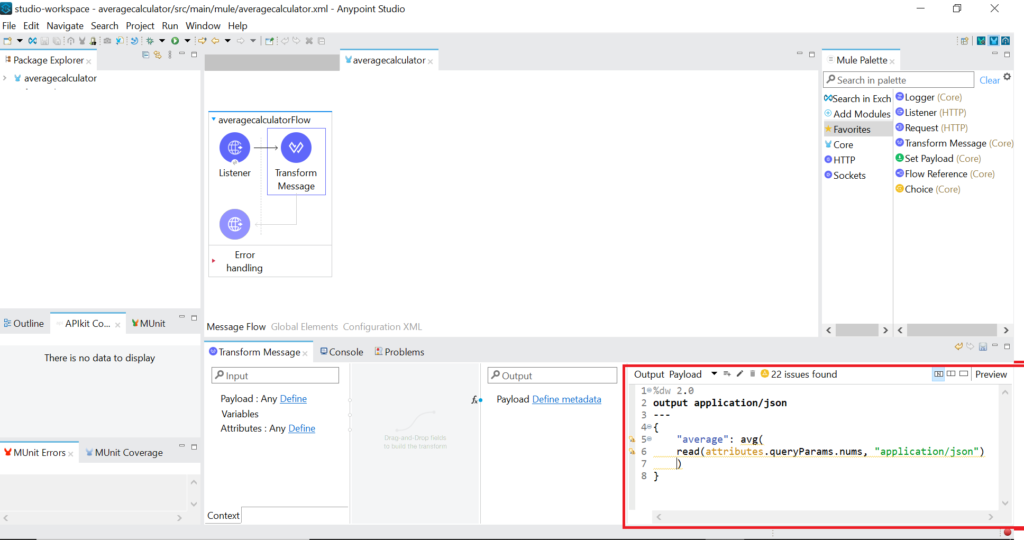
- Click the Transform Message Its properties are open, but you’re only interested in the panel called Output Payload. It’s on the right:
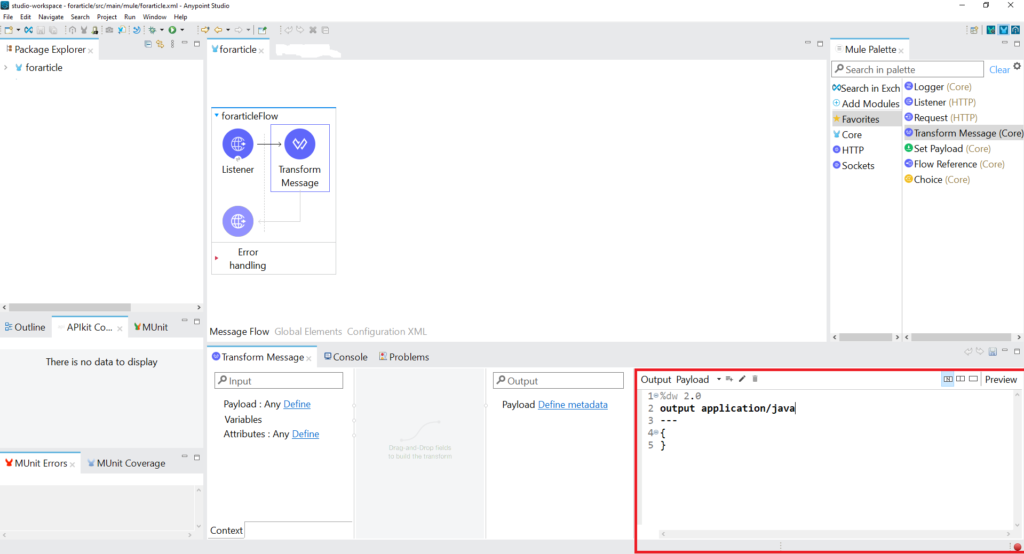
- Change the payload so that it echoes the values that go to your script’s REST and GET APIs by changing the type after output to application/json.
- Change the text under the three dashes to the following:
					    {
"average": avg(read(attributes.queryParams.nums, "application/json"))
    }
This code tells MuleSoft to fetch the GET parameter nums from the query string, read it as a JSON array of numbers, and then return its average as a number.
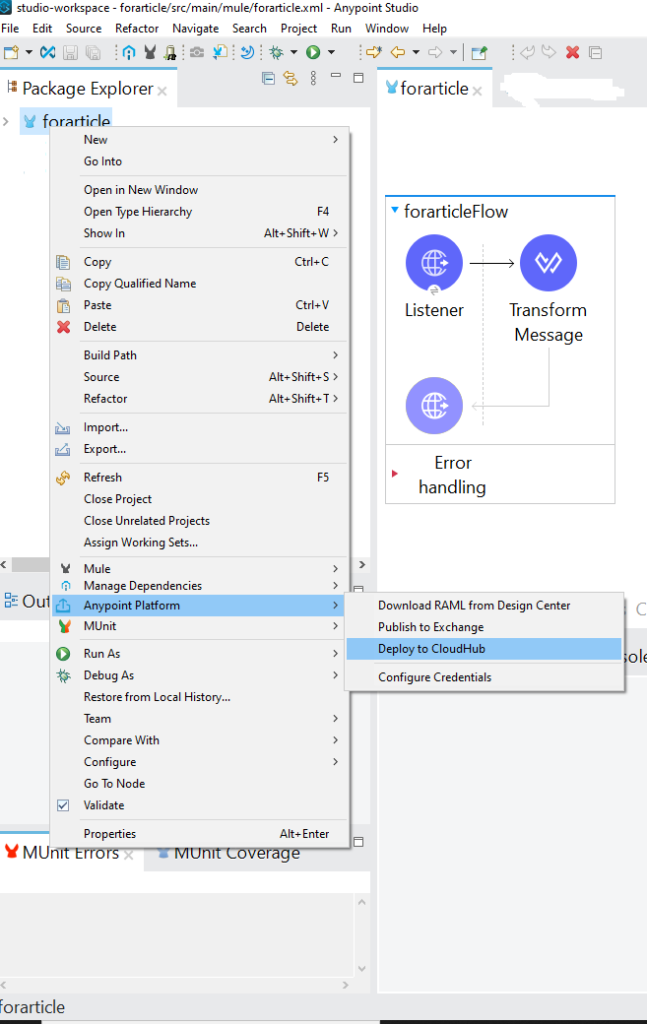
Deploying your app
Deploy your app by:- Right-clicking your package
- Hovering over the menu item called Anypoint Platform to reveal a submenu
- Selecting the option Deploy to CloudHub
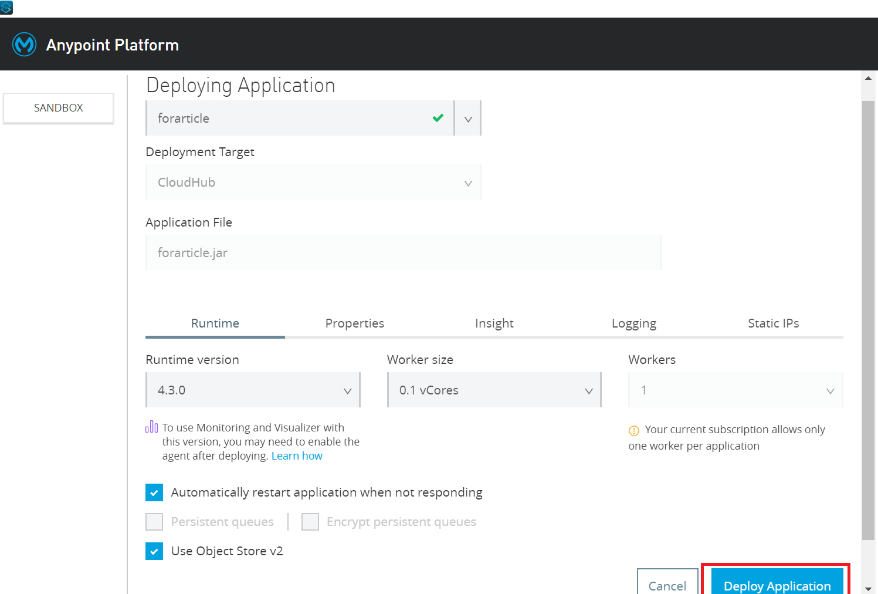
- Sign in to Anypoint Platform using the dialog box that appears. Then, enter a name and click Deploy Application at the bottom to deploy your API to CloudHub.
- Sign in to Anypoint Platform and click Runtime Manager in the menu on the left. You see your app running on the Anypoint Platform.
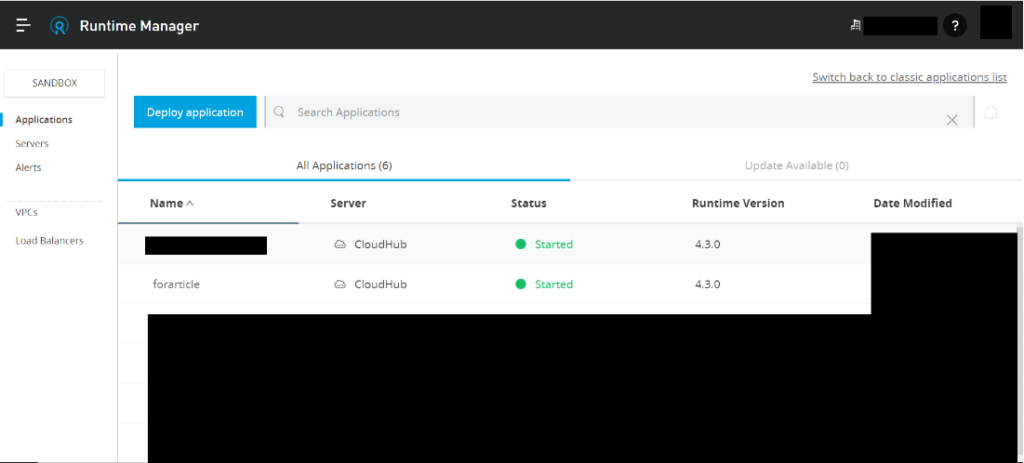
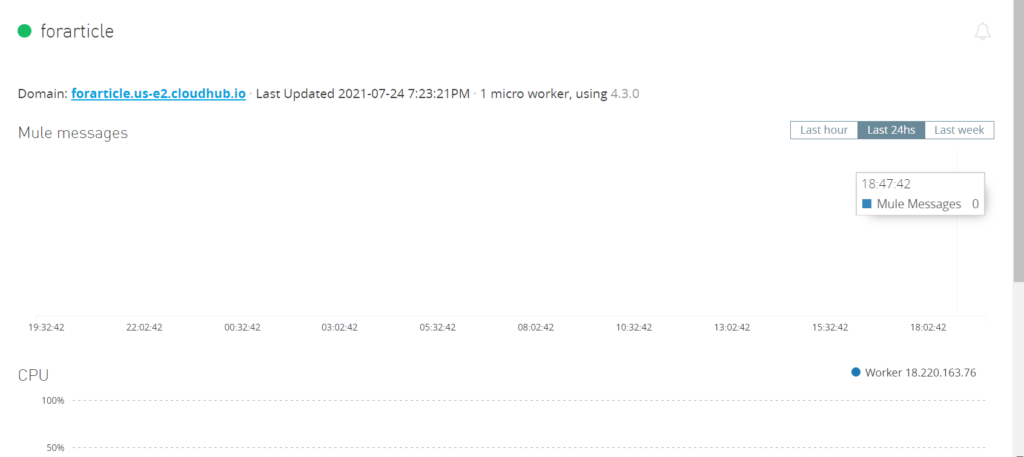
- Click the application’s name to see information about it, including the URL to which the app is listening.
- Open the link and add the following path after the domain name: /?nums={array of numbers}. This passes the JSON array
[1,2,3]to the application as astring. Thereadfunction parses thestringas JSON, and MuleSoft calculates and returns the array’s average. The JSON response looks like this:
{ "average": 2.0 }
Writing a dashboard extension
A Tableau dashboard extension consists of two parts. One part is the extension’s code itself; the other is a .trex XML file that contains your extension’s URI and any permissions it requires. The first step is getting the Tableau extensions library. You can either clone the Git repo that holds the code or download the zip file using these instructions. Now that you have the extension library, you can start creating your HTML page. We have also included the CSS and JS libraries for Bootstrap below, which require jQuery as well:
<title>MuleSoft test</title>
<!-- jQuery -->
<!-- Bootstrap -->
<!-- Extensions library -->
<!-- Our extension's code -->
<div class="container">
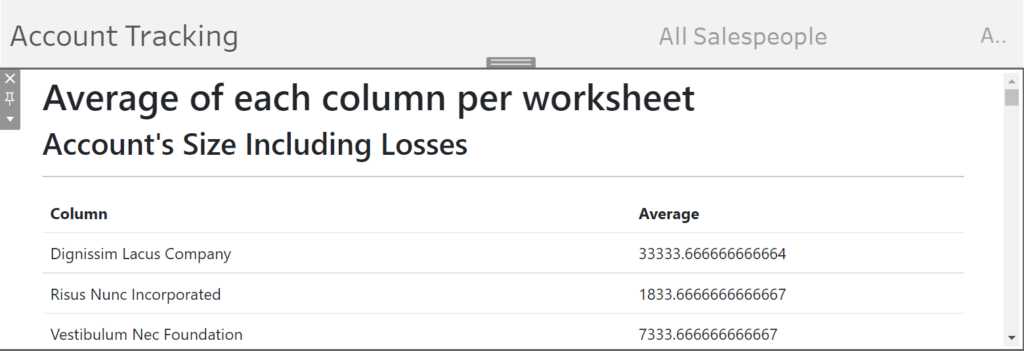
<h1>Average of each column per worksheet</h1>
<div id="dataTables"></div>
</div>
This extension pulls in your Bootstrap CSS, JavaScript, and extension script. It also includes a div where the script places the tables it generates. The script uses the Tableau JavaScript API to loop through all worksheets in the workbook, calculate the average value of each column in each worksheet, and display a list of tables in the div with the ID dataTables. Each table displays the average value of each column, calculated by calling the MuleSoft API.
The script is as follows:
"use strict";
var worksheetData = {}; // Will hold the average of each column in each worksheet
var worksheetPromises = []; // Will hold the promises returned by fetch() when we call our MuleSoft API
/**
* Converts an object containing information about a particular cell in a worksheet to just the cell's numeric value.
**/
function getValue(obj)
{
return obj._value;
}
function calcAvg(worksheetName, arr)
{
let name = arr[0]._value; // This array's name
let nums = arr.slice(1).map(getValue); // Cut off the first object, because it only contains the column's name without any data. Then we fetch just the numeric value of each cell object.
let encodedURI = "https://{YOUR_EXTENSION'S_HTTPS_URI}/?nums=" + encodeURIComponent(JSON.stringify(nums)); // Create URI with array as param
return fetch(encodedURI, {method: "GET", mode: "cors", credentials: "omit"})
.then(resp => resp.json())
.then(obj => {
worksheetData[worksheetName][name] = Number(obj.average); // Save this column's average
})
.catch(e => appendToLog("Error while sending array to MuleSoft: " + JSON.stringify(e)));
}
/**
* Adds a row for the average value of a column in a worksheet.
**/
function addAverageRow(data, tableId, columnName)
{
$("table#" + tableId).append("<tr><td>" + columnName + "</td><td>" + data[columnName] + "</td></tr>");
}
/**
* Creates a table to display the average values of each column in a given worksheet.
**/
function createWorksheetTable(tableName)
{
let tableData = worksheetData[tableName];
let tableId = tableName.replace(/\s+/g, '-').replace("'", "").toLowerCase(); // ID to use for the table that will display our worksheet's average data
$("#dataTables").append("<div id=""><h2>" + tableName + "</h2><hr /><table class="table" id=""><tr><th>Column</th><th>Average</th></tr></table><div>"); // Create a table to display this worksheet's average data
Object.keys(tableData).forEach(addAverageRow.bind(window, tableData, tableId)); // Add a row for the average of each column in the worksheet
}
/**
* Displays the average values of each column in all worksheets using the values that our API calculated.
**/
function createTables(avgData)
{
$("#dataTables").html(""); // Clear the old display tables
Object.keys(worksheetData).forEach(createWorksheetTable); // Loop through each worksheet's average data and display it as a table.
}
/**
* Calculates the average of each column in a worksheet.
**/
function handleSumData(worksheetName, data)
{
let avgs = data._data.map(calcAvg.bind(window, worksheetName)); // Calculate the average of each column in this worksheet
Promise.all(avgs).then(ignored => createTables(avgs)); // Wait for all of our calls to MuleSoft to finish, then display the results
}
/**
* Calls our MuleSoft API with the values of each row in each worksheet.
**/
function pingAPI(worksheet)
{
worksheetData[worksheet.name] = {}; // Create an object to hold the average of each column in this worksheet
worksheetPromises.push(worksheet.getSummaryDataAsync().then(handleSumData.bind(window, worksheet.name))); // Fetch this worksheet's data, then process it
}
/*
* Handles successful initialization of the Tableau library.
*/
function tabSucc()
{
const worksheets = tableau.extensions.dashboardContent.dashboard.worksheets;
worksheets.forEach(pingAPI); // Calculate average value of each column in each worksheet
}
/**
* Handles the case where the Tableau library fails to initialize.
**/
function tabFail(e)
{
alert("Error while initializing Tableau: " + e.toString());
}
/*
* Initializes Tableau.
*/
function initialize(e)
{
tableau.extensions.initializeAsync().then(tabSucc, tabFail);
}
$(document).ready(initialize);
initializeAsync function returns a Promise, which the success and failure functions handle. Upon success, the script loops through the worksheets in the workbook. For each workbook, it loops through its columns and sends the API the column’s numeric entries as a JSON array. It then saves each average value of each column of each workbook in the object worksheetData.
There are a few details to pay attention to here. The script uses CORS mode without credentials so that the browser lets your extension communicate with the MuleSoft API. The browser would block your extension’s requests otherwise because the domain where you host your extension is different from that of your MuleSoft API. Additionally, the script converts the response to JSON before reading the value MuleSoft calculated. This is because the Fetch API returns a Promise, so the script must convert the Response object to JSON to use it. Host this extension somewhere so that Tableau can call it. This tutorial hosts it locally using the http-server package to serve it.
Allowing the worksheet to connect to the server
There are a few more steps before adding the extension to your dashboard. The following steps tell Tableau to allow your worksheet to connect to your extension’s server:- Open your Tableau site
- Click the gear icon at the bottom left to go to Settings
- Click the Extensions tab near the top of the page
- Click the + Add URL button
- Add your extension’s URL to your local machine
- Allow full data access, and turn on user prompts
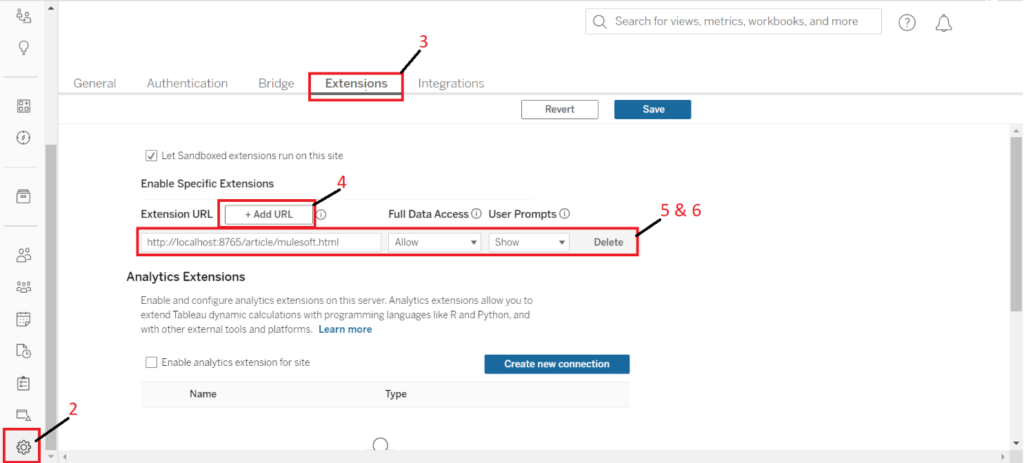
These settings also allow your extension full access to the workbook’s data so that you can get information about each worksheet.
The last file that you must create is your .trex file. Your extensions file looks like this:
        en_CA

        MuleSoft Test

        0.8

          http://localhost:8765/{PATH/TO/YOUR/PAGE}

        {BASE64_IMAGE_FOR_EXTENSION}

          full data


          MuleSoft test
Installing and starting the server
This XML records the extension’s author (you), your extension’s name, and URI. The name element contains an attribute that links to a resource called name that you define below inside the resource element. Use the same name as above for this resource element’s ID. Then write your extension’s name inside the resource element, one per locale.
This tutorial uses American English, so we’ve supplied a name for the locale en_US. However, you can add strings that Tableau will show as your extension’s name in additional locales if you wish.
Finally, Tableau includes a base64-encoded image that appears as the extension’s icon. Set up your extension’s serve as follows:
- Initialize the location where you serve your extension from using
npm:
npm init
- Install a server using
npm:
npm install http-server
- Add a script to run it to your package.json file:
					{ ...
	“scripts”:
			{
			"start": "node node_modules/http-server/bin/http-server -p 8765”
		}
	...
}
- Start the server:
npm start
Now that your server is up, there’s only one step left before you can add your extension to your dashboard. Go back to your workbook, locate the Extension object on the left, and drag it to your dashboard. Once you’ve done that, the following dialog box appears:
- Click Access Local Extensions on the left, navigate to the folder where your .trex
file is located. - In the File dialog box, upload the file to add your extension to the dashboard.
Your extension then appears on your dashboard, but you’re not quite done yet. Tableau protects users’ privacy by asking them for permission to run an extension in their workbook. A dialog box appears that looks like this:
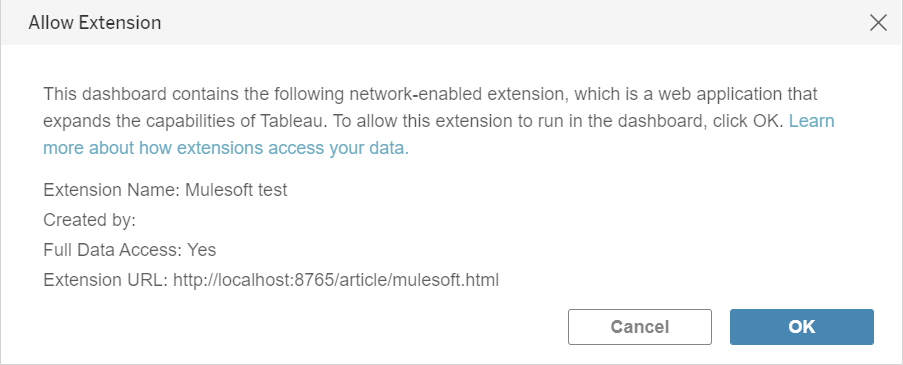
- Click OK to allow the extension to run. Your extension now loads and runs.
You can now load your extension from your workbook. The extension runs like any other webpage, except that the Tableau API gives it full access to your workbook’s data. Although this extension leverages MuleSoft to calculate averages, you can extend both the MuleSoft API and the Tableau extension to process the workbook’s data more extensively. You can also create custom visualizations of your data to help you extract domain-specific insights.
Conclusion
You’ve now seen the power of Tableau and MuleSoft. Tableau provides powerful tools to analyze and visualize your data. MuleSoft makes creating an API fast. Plus, it’s versatile in the operations it performs. But you can take things even further by writing your extensions, which can access as much of your workbook’s data as you allow them. Once you’ve done that, you can connect them to your MuleSoft API to have your application analyze data taken straight from your dashboard’s worksheets. Then, you have your Tableau extension display the data directly on your dashboard.
This is only a look at the basic capabilities of Tableau and MuleSoft, but the documentation in the Tableau extension library and MuleSoft’s AnyPoint Platform shows you how to go so much further in creating custom tools to process your worksheets’ data as you see fit. Only the nature of your data and your imagination limit the possibilities.
If you’re interested in developing expert technical content that performs, let’s have a conversation today.