Search

How to Add Excel Import and Export to your Vue App

“It looks great, but could you just add Excel import?”

If you’ve developed software for a long time, you’ve probably heard that question from a manager more than once. To a non-technical crowd, asking for Excel import/export doesn’t sound like a big deal. How hard could it be, right?

But all too often, this question strikes fear into the hearts of developers. On most platforms, working with Excel files requires lots of work. Historically, this has been doubly true on the web. Working with Excel data in a web app has felt a bit like this xkcd comic: “It can be hard to explain the difference between the easy, and the virtually impossible.” Building your own in-browser spreadsheet with Excel import and Excel export feels like a problem that will take five years and a research team to solve.

That’s changing. We now have turnkey libraries that let you drop a fully-functioning spreadsheet into your web app. SpreadJS is one of them. We’re going to look at how to take an existing Vue app – a real world app using a Vuex store – and enhance it using SpreadJS.

The rest of the article assumes that you already understand HTML, CSS, and JavaScript. It also assumes you have a working knowledge of the Vue.js progressive JavaScript framework for creating web UI. It will help if you’ve used Vuex for state management, but don’t worry if you haven’t. It’s intuitive and easy to understand, and you’ll be able to figure out what’s going on just by reading the code if you’ve used Vue.

The Vue App

The Vue app we’ll be working on is a straightforward sales dashboard with a few summary panels and a table of data. It’s the kind of app that falls into the “not bad” category:

How to Add Excel Import and Export to your Vue App

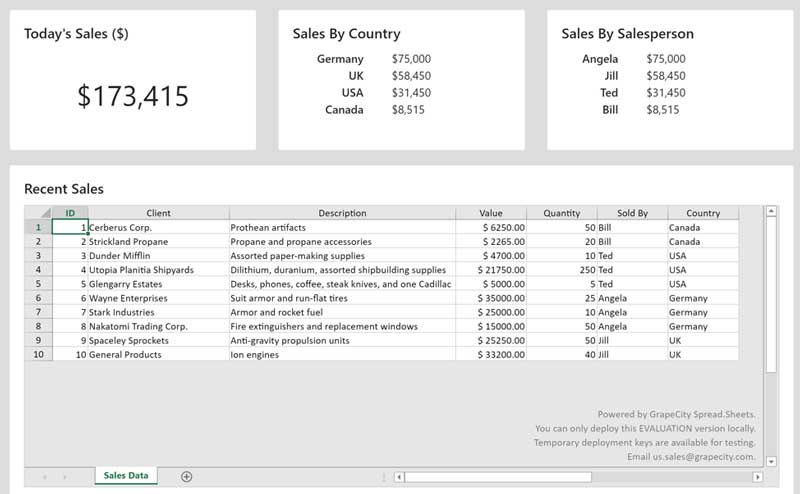
Although it’s just a demo, it’s exactly the kind of app that enterprise web developers have to create. It’s also exactly the kind of app that we’re typically asked to add Excel functionality to, so it will be a perfect example for the rest of this article.

You can see the app running live on CodeSandbox.

To set the stage: the dashboard is a single page application made with Vue. It’s using the latest and greatest Vue best practices: single-file components and a Vuex data store. It’s also using Bootstrap for its CSS components and grid system.

Bootstrap isn’t as popular as it used to be. But in reality, Bootstrap is still everywhere – especially in the kinds of enterprise web apps where Excel support is usually needed. I’d wager that plenty of new enterprise web apps will still use Bootstrap in 2030.

If you’d rather use Bulma or Tachyons in your own spreadsheet-enabled apps, go right ahead! SpreadJS will work happily with either of them.

Vue Application Structure

Let’s take a look at how the code is structured. Our Vuex store and Vue application are both defined in index.js. We have several single-file Vue components, all located in the components folder.

If you look at our Vuex store, you’ll see the following:

				
					const store = new Vuex.Store({  
  state: {  
    recentSales  
  }  
});


Our store’s initial state is just set to the value of recentSales, which is a set of dummy data we imported.

Wait a minute – if we’ve only got one set of data, how are we generating three charts and a table? To see what’s happening, open up the Dashboard.vue component. In it, you’ll see several computed properties are being generated based on the data in the Vuex store:

				
					<template>  
  <div style="background-color: #ddd">  
      <NavBar title="Awesome Dashboard"/>  
      <div class="container">  
      <div class="row">  
      <TotalSales :total="totalSales"/>  
      <SalesByCountry :salesData="countrySales"/>  
      <SalesByPerson :salesData="personSales"/>  
      <SalesTable :tableData="salesTableData"/>  
      </div>  
      </div>  
  </div>  
</template>

<script>  
import NavBar from "./NavBar";  
import TotalSales from "./TotalSales";  
import SalesByCountry from "./SalesByCountry";  
import SalesByPerson from "./SalesByPerson";  
import SalesTable from "./SalesTable";  
import { groupBySum } from "../util/util";

export default {  
  components: { NavBar, SalesByCountry, SalesByPerson, SalesTable, TotalSales },  
  computed: {  
      totalSales() {  
        const total = this.$store.state.recentSales.reduce(  
          (acc, sale) => (acc += sale.value), 0);  
        return parseInt(total);  
      },  
      countrySales() {  
        const items = this.$store.state.recentSales;  
        const groups = groupBySum(items, "country", "value");  
        return groups;  
      },  
      personSales() {  
        const items = this.$store.state.recentSales;  
        const groups = groupBySum(items, "soldBy", "value");  
        return groups;  
      },  
      salesTableData() {  
        return this.$store.state.recentSales;  
      }  
  }  
};  
</script>


Now it makes more sense! The single data set contains everything we need to generate all of the numbers and tables for our dashboard. Since the data is in a reactive Vuex store, if the data updates then all of the dashboard panels will update automatically.

This reactivity will come in very handy in the next section, when we replace our boring old static table with an editable spreadsheet.

Adding SpreadJS to your Vue App

Here’s where the fun starts! We have our dashboard, but we want to get rid of that clunky old HTML table. So we’ll have to change things up a little bit. CodeSandbox was great for seeing our starting point, but we must run our app locally to use SpreadJS in development mode without a license.

You can clone a copy of the code from the following GitHub repository: https://github.com/rpeden/vue-spreadjs. Once you’ve done that, open a terminal, navigate to the directory where you cloned the repository and run ‘npm install’. This installs the dependencies needed to run the application. When dependency installation finishes, run ‘npm serve’ to see the updated app in action.

Let’s walk through the changes we’ll have to make to upgrade our old app to its new and improved version. Since we’re going to replace our sales table with a spreadsheet, we’re going to put the sheet into our existing SalesTable component. But first, we’ll have to get rid of our old table. Once it is gone, our SalesTable template will look like this:

				
					<template>  
  <TablePanel title="Recent Sales">  
  </TablePanel>  
</template>


After eliminating the table, we’ve got our table panel ready and waiting for a spreadsheet, so let’s add one! After adding a SpreadJS sheet, our template will look like this:

				
					<template>  
  <TablePanel title="Recent Sales">  
    <gc-spread-sheets :hostClass='hostClass' @workbookInitialized='workbookInit'>  
      <gc-worksheet :dataSource='tableData'          :autoGenerateColumns='autoGenerateColumns'>  
        <gc-column  
            :width='50'  
            :dataField="'id'"  
            :headerText="'ID'"  
            :visible = 'visible'  
            :resizable = 'resizable'  
          >  
        </gc-column>  
        <gc-column  
            :width='300'  
            :dataField="'client'"  
            :headerText="'Client'"  
            :visible = 'visible'  
            :resizable = 'resizable'  
        >  
        </gc-column>  
        <gc-column  
            :width="350"  
            :headerText="'Description'"  
            :dataField="'description'"  
            :visible = 'visible'  
            :resizable = 'resizable'  
        >  
        </gc-column>  
        <gc-column  
            :width="100"  
            :dataField="'value'"  
            :headerText="'Value'"  
            :visible = 'visible'  
            :formatter = 'priceFormatter'  
            :resizable = 'resizable'  
          >  
          </gc-column>  
          <gc-column  
            :width="100"  
            :dataField="'itemCount'"  
            :headerText="'Quantity'"  
            :visible = 'visible'  
            :resizable = 'resizable'  
          >  
          </gc-column>  
          <gc-column  
            :width="100"  
            :dataField="'soldBy'"  
            :headerText="'Sold By'"  
            :visible = 'visible'  
            :resizable = 'resizable'  
          ></gc-column>  
          <gc-column  
            :width="100"  
            :dataField="'country'"  
            :headerText="'Country'"  
            :visible = 'visible'  
            :resizable = 'resizable'  
          ></gc-column>        
      </gc-worksheet>  
    </gc-spread-sheets>  
  </TablePanel>  
</template>


That’s a lot to take in, so let’s walk through it to understand what is happening.

First, we create a spreadsheet by using the gc-spread-sheets element and binding it to two of our component’s properties: hostClass and workbookInit.

Inside the spreadsheet, we create a new worksheet with the gc-worksheet element and binding it to our component’s tableData and autoGenerateColumns properties. Note that tableData is exactly the same tableData we used to generate our plain HTML table. We can put our data into SpreadJS as-is with no changes required!

Finally, inside the worksheet we define columns that tell SpreadJS how to display our data. The dataField property tells us which property of the underlying dataset this column should display, and headerText gives SpreadJS a nicely-formatted column name to use. The rest of the bindings for each column are straightforward; the SpreadJS documentation has a complete list of everything you can pass to a gc-column.

So with our template in place, exactly how much code is going to be needed to make this all work? Fortunately, not much at all! Here’s our SalesTable component’s new script code:

				
					import "@grapecity/spread-sheets/styles/gc.spread.sheets.excel2016colorful.css";

_// SpreadJS imports_  
import "@grapecity/spread-sheets-vue";  
import Excel from "@grapecity/spread-excelio";

import TablePanel from "./TablePanel";  
export default {  
  components: { TablePanel },  
  props: ["tableData"],  
  data(){  
      return {  
        hostClass:'spreadsheet',  
        autoGenerateColumns:true,  
        width:200,  
        visible:true,  
        resizable:true,  
        priceFormatter:"$ #.00"  
      }  
    },  
  methods: {  
      workbookInit: function(_spread_) {  
        this._spread = spread;  
      }  
    }  
};


Due to Vue’s simplicity, it takes very little code to make this work. If there’s anything here you’re unfamiliar with, the ‘Components In-depth’ section of the Vue documentation explains Vue components in detail. The only things that have changed from before are a few imports, some data properties, and a couple of methods. The data properties should look familiar; we saw them a moment ago in the template. They’re configuration options we are binding to the components in our SpreadJS spreadsheet.

The workbookInit method is a callback that SpreadJS calls when the sheet is initialized. In this method, we save our SheetJS spreadsheet object as an instance variable on our component so we can interact with it directly if necessary.

One final change: we give our component a scoped style to help the spreadsheet style itself. We saw this earlier when we passed the hostClass to the gc-spread-sheets element. Since hostClass is set to ‘spreadsheet’, we’re going to create a CSS class named spreadsheet:

				
					<style scoped>  
.spreadsheet {  
  width: 100%;  
  height: 400px;  
  border: 1px solid lightgray;  
}  
</style>


And at this point, if we make no other changes and load our Dashboard, it will look like this:

But wait, there’s more!

Remember how we passed our table data to the spreadsheet without making any changes to the data set? Now that our data is in a spreadsheet, we can edit it.

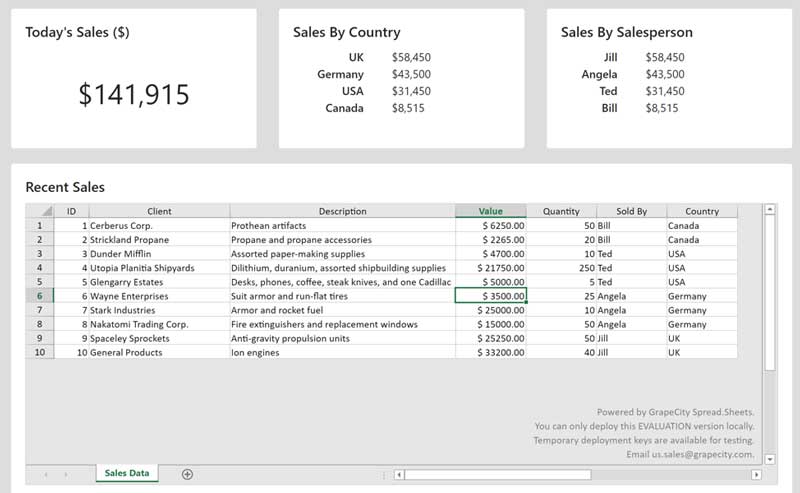
What will happen if we change the value of sale #6 from $35,000 to $3500? If we go into the sheet and edit the value, we get a dashboard that looks like this:

How to Add Excel Import and Export to your Vue App

Wow! What happened?!?

We updated the SpreadJS sheet, and it automatically updated our Vuex store. We didn’t have to add any code to make this happen. It just worked! The SpreadJS Vue wrapper is reactive out of the box.

It also looks like Angela went from having a spectacular sales month to having a mediocre one. Sorry about that, Angela!

I’m a veteran developer who isn’t easily impressed, but I admit that this brought a smile to my face. I was expecting to manually wire up change handlers to bind spreadsheet changes back to my Vuex store, but SpreadJS handled it for me.

We now have an enhanced dashboard that a manager would be happy with. They can modify the data and watch the dashboard update before their eyes. But we can do even better by adding the ability to import and export Excel files. Next, we’ll learn how to do that.

Adding Excel Export

Adding Excel export to our sheet is easy. First, let’s add an export button to our dashboard. We’re going to place it at the bottom of our table panel, right after the gc-spread-sheets closing tag:

				
					&hellip;  
    </gc-spread-sheets>  
    <div class="dashboardRow">  
      <button class="btn btn-primary dashboardButton" @click="exportSheet">  
        Export to Excel  
      </button>  
    </div>  
  </TablePanel>  
</template>


As you can see, our button is expecting a click handler named exportSheet. We’ll add it in a moment, but first we’re we will import a function from an NPM package named file-saver:

				
					import { saveAs } from 'file-saver';


Next, let’s add exportSheet to our component’s methods object:

				
					exportSheet: function() {  
  const spread = this._spread;  
  const fileName = "SalesData.xlsx";  
  const sheet = spread.getSheet(0);  
  const excelIO = new Excel.IO();  
  const json = JSON.stringify(spread.toJSON({  
      includeBindingSource: true,  
      columnHeadersAsFrozenRows: true,  
  }));  
  excelIO.save(json, function(_blob_){  
    saveAs(blob, fileName);  
  }, function (_e_) {   
    console.log(e)   
  });  
}


Here’s what the code is doing: first, we get a reference to our Sales Data sheet. Since it’s the only sheet in our spreadsheet, it lives at index 0 and we access it by calling getSheet.

When then instantiate SpreadJS’ ExcelIO library, convert our sheet to JSON, and ask SpreadJS to save it. And voila! We’ve exported an Excel file from our spreadsheet-enabled Vue app!

Note that we’re passing two serialization options to the sheet’s toJSON call: includeBindingSource and columnHeadersAsFrozenRows. Together, these options ensure that the data we bound to the sheet is exported correctly, and that the sheet contains our column headers so anyway looking at the exported Excel file will understand what each column contains.

Adding Excel Import

Next, it’s time to add the ability to import Excel files.

Right below our export button, we’re going to add the following bit of markup:

				
					<div>  
  <b>Import Excel File:</b>  
  <div>  
    <input type="file" class="fileSelect" @change='fileChange($event)' />  
  </div>  
</div>


As you can see, we’re going to be using a standard HTML file picker, and triggering a component method named fileChange when a file is selected.

Now that we’ve added the template, let’s add the change handler to our component’s methods object:

				
					fileChange: function (_e_) {  
      if (this._spread) {  
      const fileDom = e.target || e.srcElement;  
      const excelIO = new Excel.IO();  
      const spread = this._spread;  
      const store = this.$store;

      excelIO.open(fileDom.files[0], (_data_) => {  
      const newSalesData = extractSheetData(data);  
      store.commit('updateRecentSales', newSalesData)  
    });  
  }  
}


Importing an Excel file is much the same as exporting it, except in reverse. After a file is chosen, we ask ExcelIO to import it. When done, it passes the sheet information to a callback function as a JavaScript object. Next, we pass the imported data through a custom function to extract the data we need from it and then commit it back to the Vuex store.

In our extractSheetData function – which you’ll find in the src/util.util.js file – you’ll see that we pull data out of the JavaScript object returned by ExcelIO and restructure it to match the shape of the data in our Vuex store.

Our import function assumes that the data in the imported sheet will have the same columns as our original data set. If someone uploads a spreadsheet that doesn’t meet this requirement, our app won’t be able to handle it. This is an acceptable limitation in most line-of-business apps. Since our dashboard is designed to display a specific type of data, it’s reasonable to ask users to supply data in the format the app is expecting.

When data extraction is complete, we call commit on the Vuex store and send the updated sales transaction data. The SpreadJS sheet and all of the dashboard panels then update themselves to reflect the new data.

Testing Your Vue App

Now that seen the code, let’s test out Excel import and export in our Vue app.

Start by clicking the ‘Export to Excel’ button. Your web browser will then download an Excel spreadsheet containing all of the data we saw in our dashboard’s spreadsheet.

Open the sheet in Excel and add a couple of lines of data. It’s okay if you use new countries or new salespeople; all our dashboard components can handle it. Just be careful not to change the column order or names. When you’re finished, click the ‘Choose File’ button at the bottom of the Recent Sales panel. Select the Excel file you just edited.

When you select the file, you’ll see all of the dashboard components update.

Conclusion

We’re done! We took an ordinary Vue dashboard app and added a live spreadsheet to it. We can now edit the data in the sheet and watch our entire dashboard update itself. Our enhanced dashboard is also able to import and export Excel files.

Vue, Vuex, and SpreadJS complement each other well. With Vue’s easy templating and data binding, Vuex’s reactive data store, and SpreadJS’ interactive spreadsheets, complex enterprise JavaScript apps can be created in hours.

As great as this might seem, we’ve barely scratched the surface of what SpreadJS can do. To better understand what SpreadJS can do for you, refer to SpreadJS tutorial site. If you’re looking to dive deeper into using SpreadJS in your own apps, the SpreadJS Developer’s Guide has the information you need.

What’s Next

Our dashboard with a spreadsheet is great. It’s missing something, though. What’s one thing managers love to see on dashboards?
Charts!

Fortunately, SpreadJS has built-in charting support. In a future article, we’re going to learn how to enhance our dashboard with SpreadJS charts. In another article we discuss how to slice your JavaScript charts with SpreadJS slicers.

If you’re interested in developing expert technical content that performs, let’s have a conversation today.

Facebook
Twitter
LinkedIn
Reddit
Email

POST INFORMATION

If you work in a tech space and aren’t sure if we cover you, hit the button below to get in touch with us. Tell us a little about your content goals or your project, and we’ll reach back within 2 business days. 

Share via
Copy link
Powered by Social Snap