Bundling various data sources, APIs, services, applications, and several data streams while managing application data integration can become cumbersome. It’s so complex that it typically results in application performance loss. So, database administrators use Apache Ignite, a distributed database that provides high-performance computing capabilities using in-memory speed. Integrating Apache Ignite as an in-memory caching or distributed database solution helps improve the velocity and performance of complex architecture.
But, at the same time, this solution presents new challenges: we’re integrating yet another component into our already complex architecture. GridGain provides a solution to this challenge. It enables monitoring, managing, and troubleshooting Apache Ignite clustered environments, whether they’re running as an on-premises solution or as an SaaS offering in the cloud.
Organizations are turning to GridGain for debugging, clearing SQL query performance bottlenecks, tracing heavy-load applications’ performance, proactively managing data skews to maximize cluster use, and more.
This article shows how to configure an Ignite cluster to work with GridGain Control Center and what we can do with it.
Apache Ignite Setup
Before setting up the GridGain Control Center, you must have your Apache Ignite cluster up and running. The article won’t go into too much detail about installing this software but instead will provide the basic steps to understand GridGain integration. Feel free to follow along and build your proof of concept.
You can install Apache Ignite on Linux and Windows operating systems and run it as a preconfigured Docker container. For example, you can deploy on-premises or cloud-running Kubernetes infrastructures like Azure, AWS, or GCP. The latest versions are available for download from the Apache Ignite website, Apache Ignite Downloads.
Note that the environment in which you run Apache Ignite doesn’t influence the GridGain Control Center. It communicates with the cluster, in the same way, providing you with the same features.
The sample scenario we use in this article runs on a cluster of two Apache Ignite nodes running on Windows Server 2016. You can manage GridGain’s orchestration using the SaaS-hosted version of the GridGain Control Center.
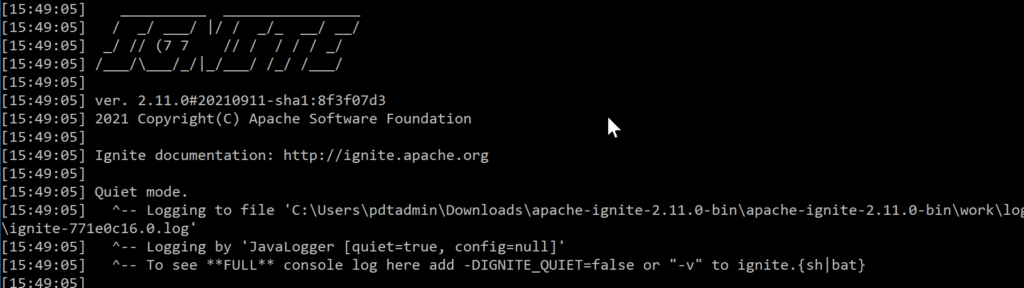
Once you download the binary files from the Ignite website, extract them to a directory on your server. Next, run ignite.bat or ignite.sh from within the bin directory. This command starts the Command shell and runs Ignite. The Ignite logo appears together with some diagnostics and logging information related to the run-time.
Running the GridGain Control Center
You can install the GridGain Control Center in several ways, including a complete software installation on a Linux machine, a Docker Container stand-alone, a Kubernetes-based scenario, or using the SaaS-hosted alternative. There’s no functionality or feature difference between the various topologies. For this article, we use the hosted SaaS trial version.
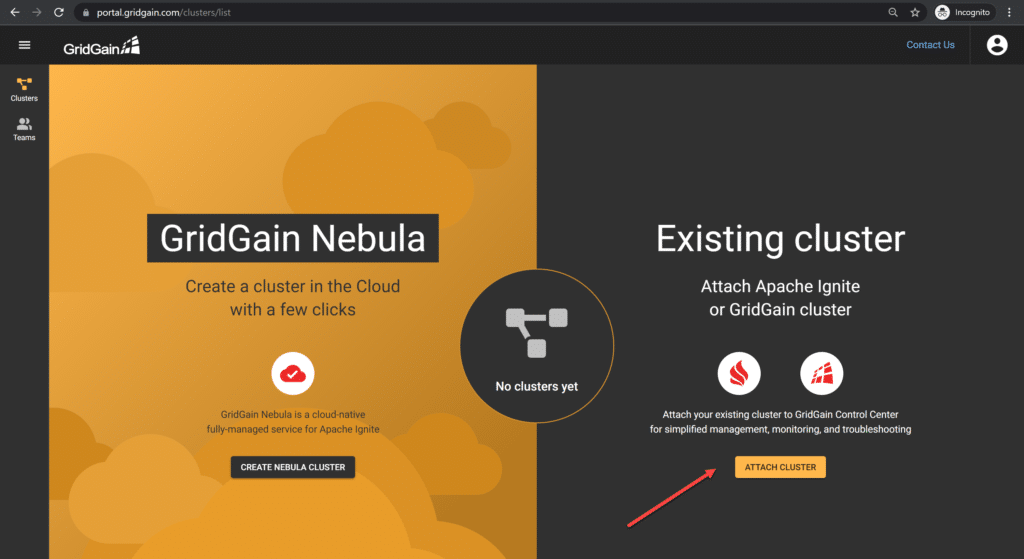
Create a GridGain account if you don’t have one yet. Once authenticated, you must choose either GridGain Nebula or Existing Cluster. Choose Existing Cluster by clicking Attach Cluster.
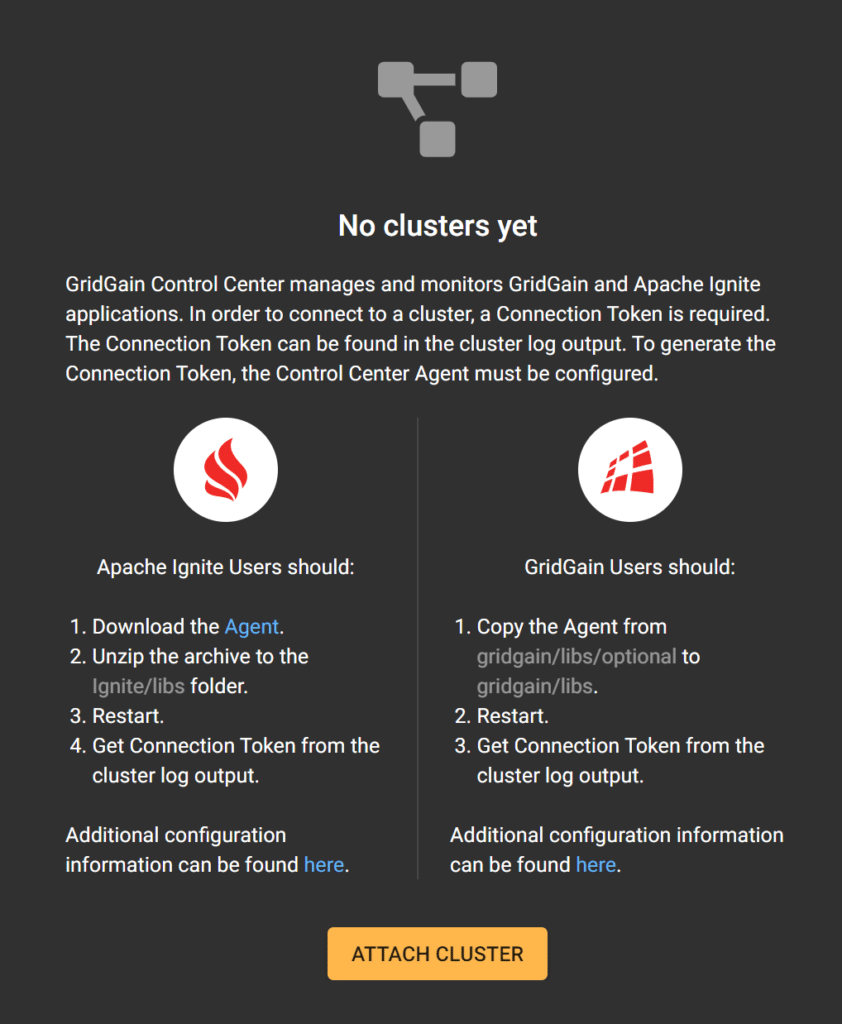
To add your Apache Ignite clusters, click Download the Agent in the Apache Ignite Users Should section. This redirects you to the GridGain download web page.
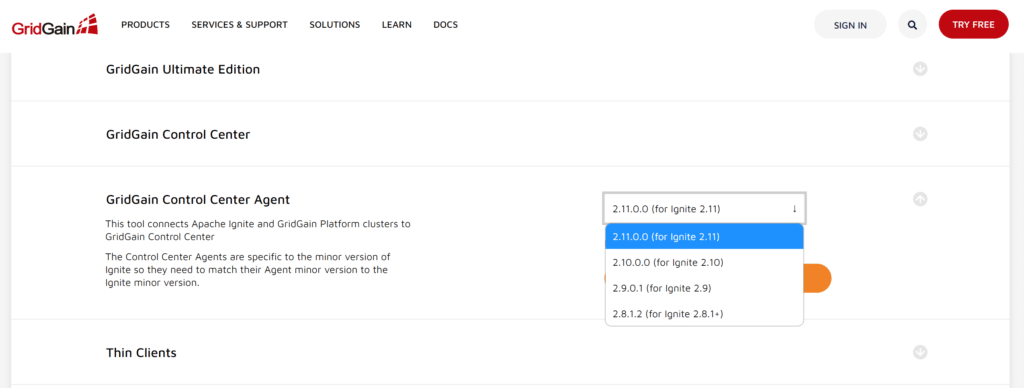
Now select Software, then select GridGain Control Center Agent from the list of downloads.
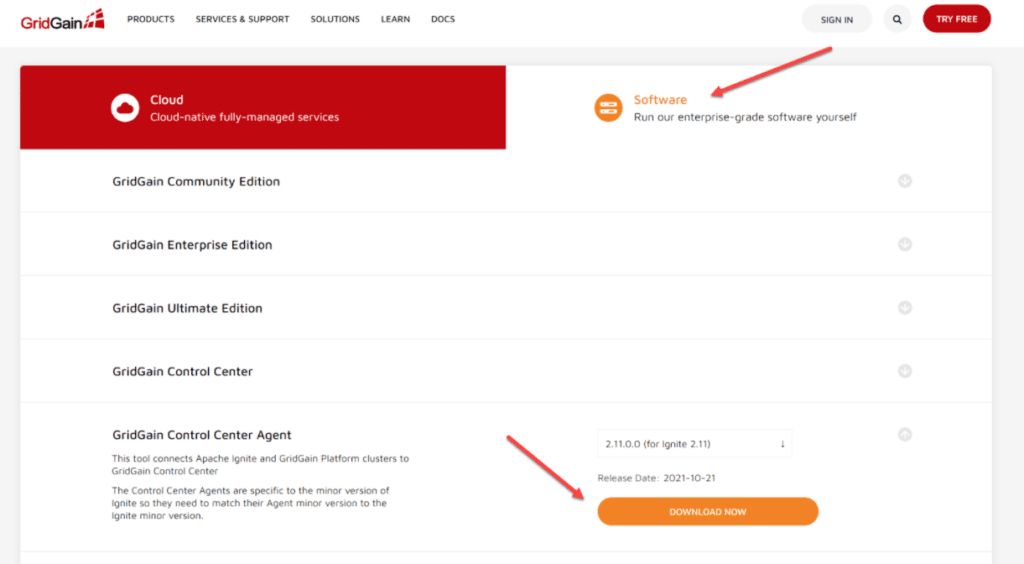
Now select the agent for your Ignite platform. Ensure the agent version corresponds to the Ignite version you’re running (2.11.0.0 is the most recent one).
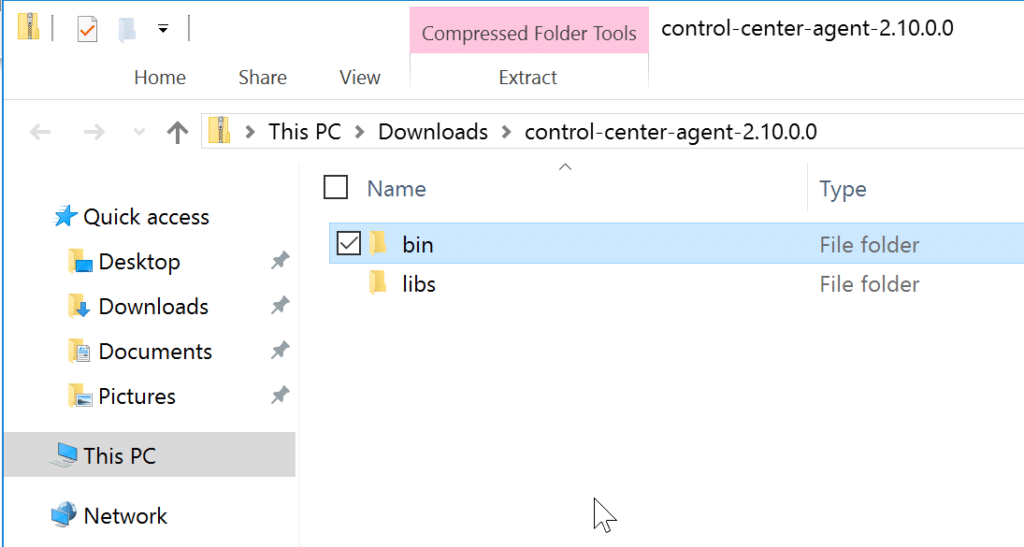
Download and extract the Agent archive to your local management station, and extract the ZIP file into its own ignite folder. Unpack the archive into the folder with the Apache Ignite installation. The archive contains the bin and libs folders.
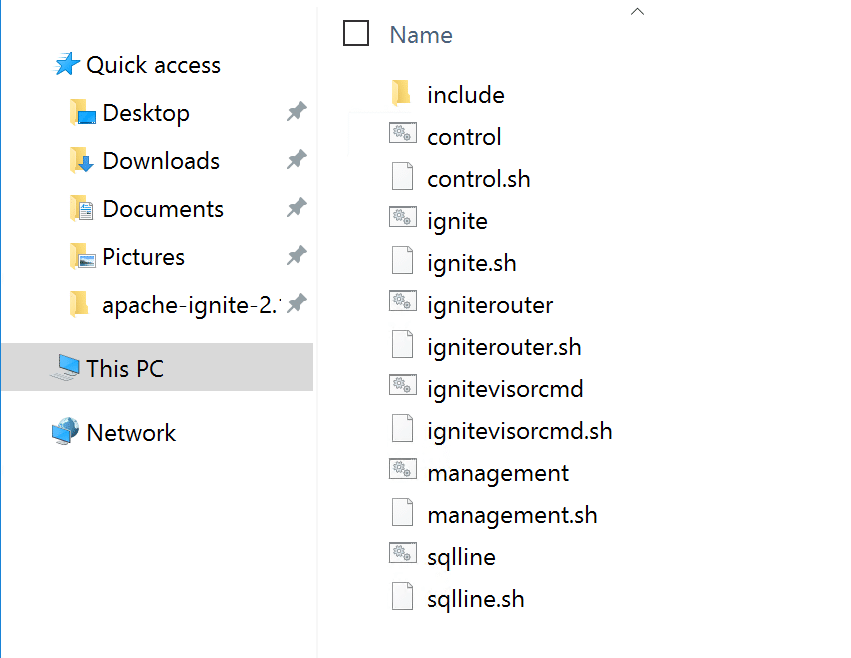
Your running Ignite instance contains the same folders in the Program Files folder (on Windows Server). Copy the bin folder into the root of the Ignite Program Files folder, where you already have a bin subfolder. After copying, the contents should look like the screenshot below:
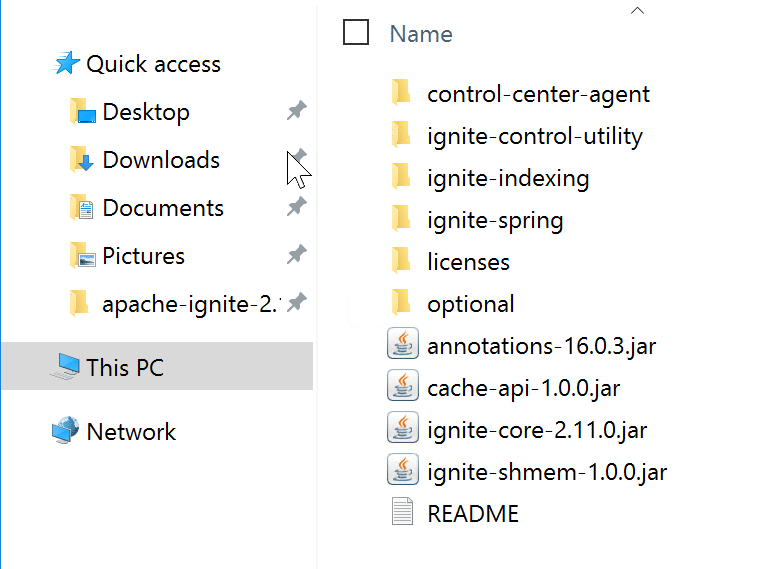
Repeat the same process for the libs folder, copying it to the root of the Ignite Program Files directory. After copying, the contents should look like the screenshot below:
control-center-agent module and provide a unique token and direct URL to connect to the GridGain Control Center. 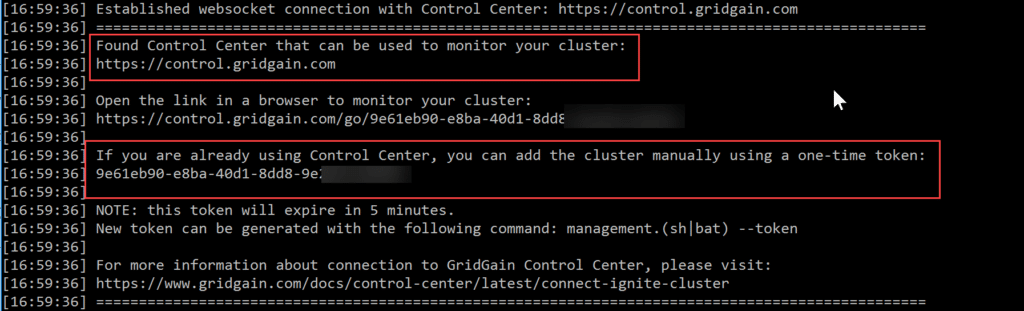
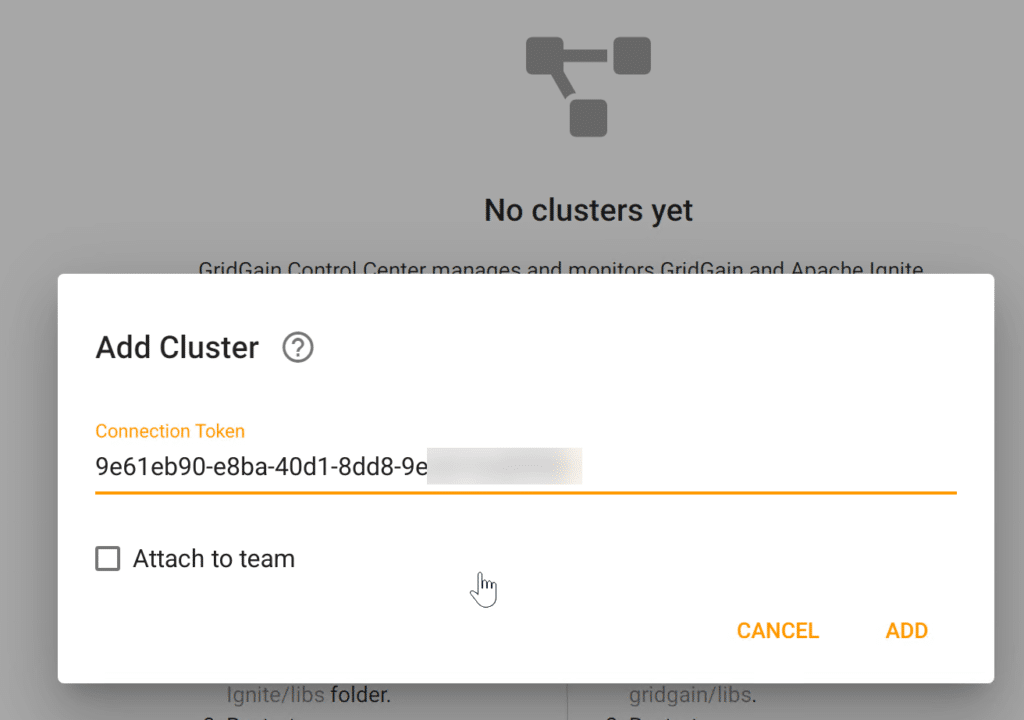
If you want to add this Ignite node to the Control Center manually, copy the token to the clipboard, and in the GridGain Control Center, click Add Cluster.
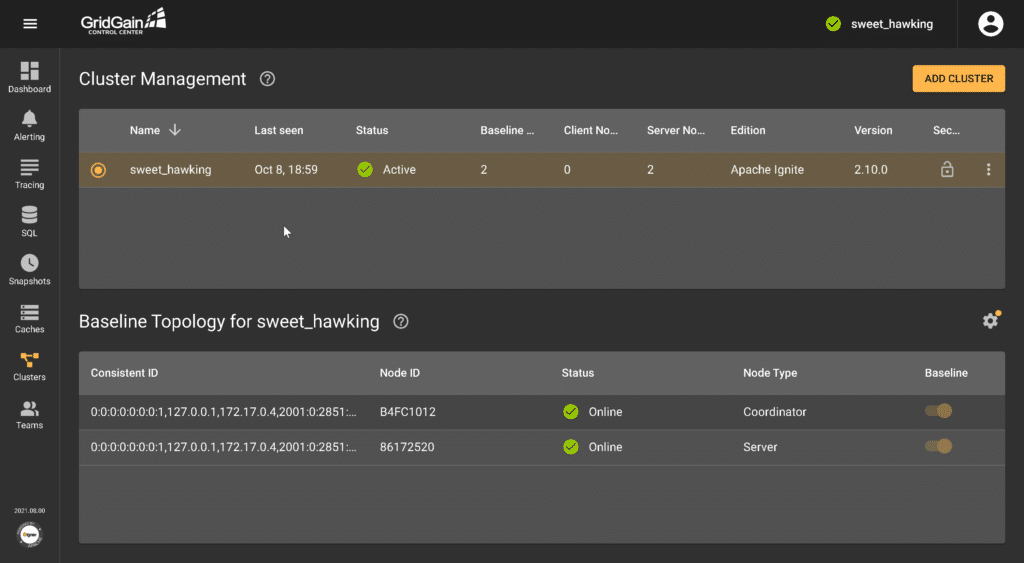
Clicking Add Cluster adds the node to the Control Center Dashboard, listing the different nodes in the cluster.
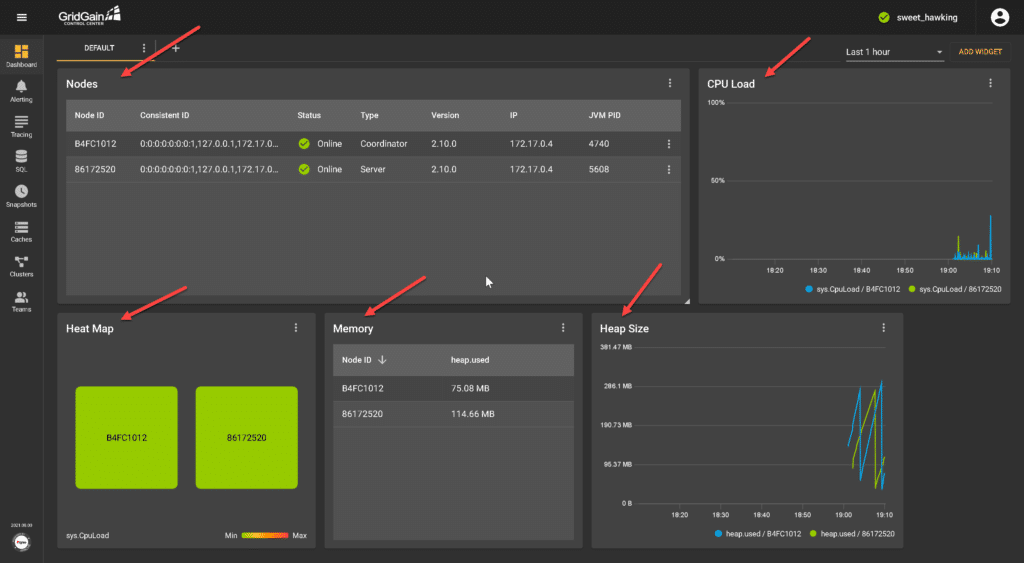
On the toolbar on the left, click Dashboard. The dashboard displays each node’s health, CPU, memory, heap size, and heat map in real-time.
We’re set up now and ready to dig into some of the core Control Center capabilities and features.
Using the GridGain Control Center
GridGain offers a multitude of features for typical administrative tasks when managing an Apache Ignite cluster environment. Let’s briefly touch on some of them.
Monitor Status and Performance Information
The previous screenshots show you what the dashboard does. The dashboard gives you a single-page view of your cluster nodes, performance, CPU load, heap map, and heat.
Manage Clusters
You can view each node’s name and ID, as well as the status and role of each running node.
Receive Alerts
The Alert feature enables you to define notifications (email or text messages) for more than 150 customizable metrics. Let’s quickly set up an alert for losing a node in our monitored cluster.
On the toolbar on the left, click Alerts. Then, click Add Configuration.
Complete the necessary parameters, using the following sample data:
- Name: Provide a clear name for the alert — for example,
- Metric Name: From the pop-up window listing metrics, select the cluster metric option, then choose ServerNodesCount as the metric.
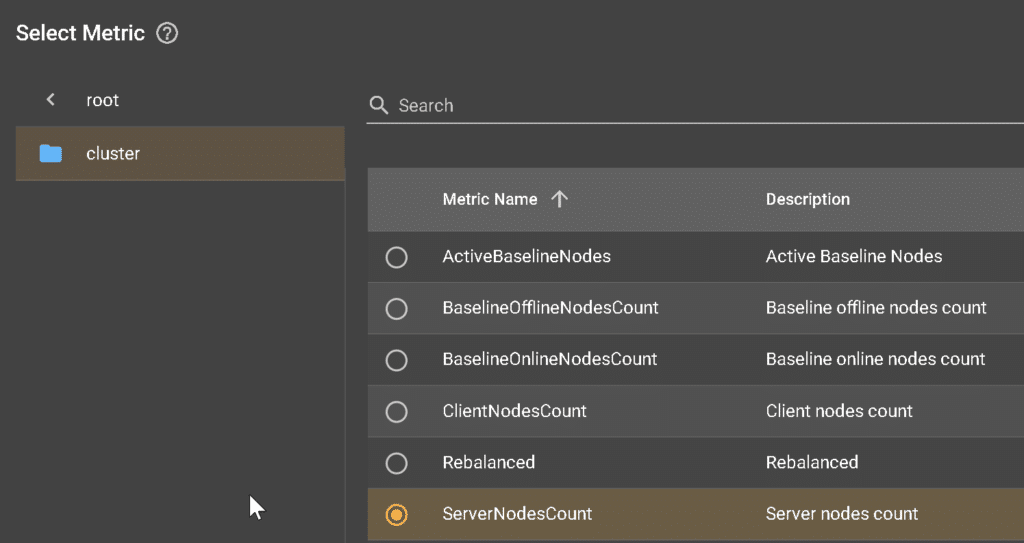
- Save the metric setting by clicking OK.
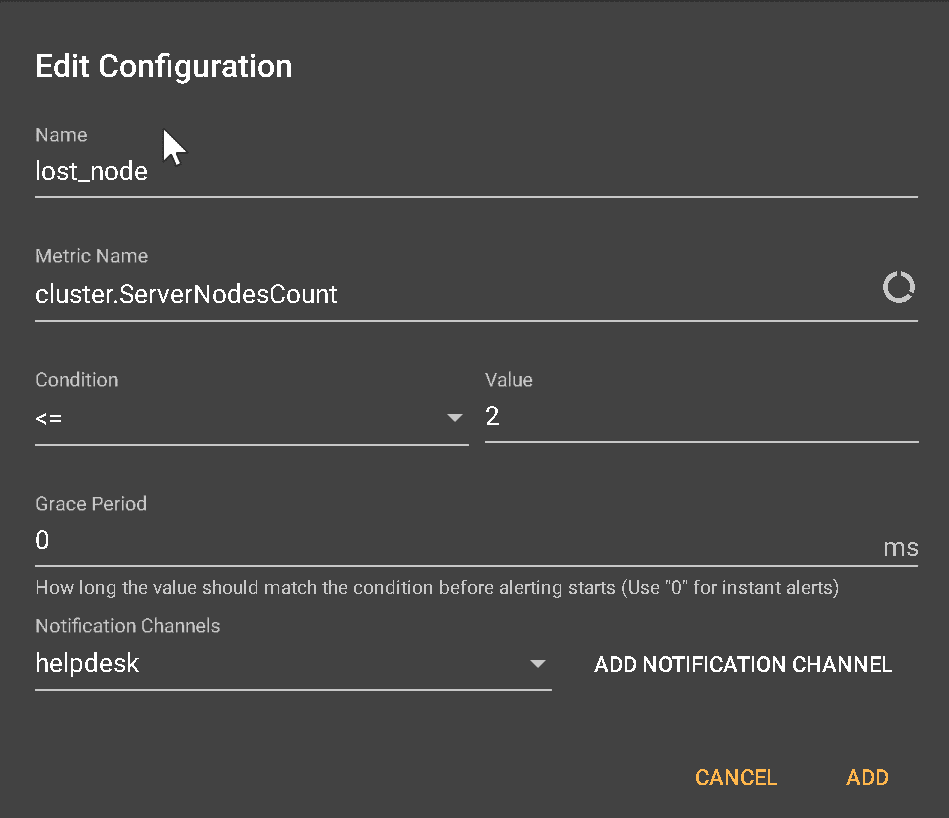
- Notice that the Add Configuration window now has a Condition field.
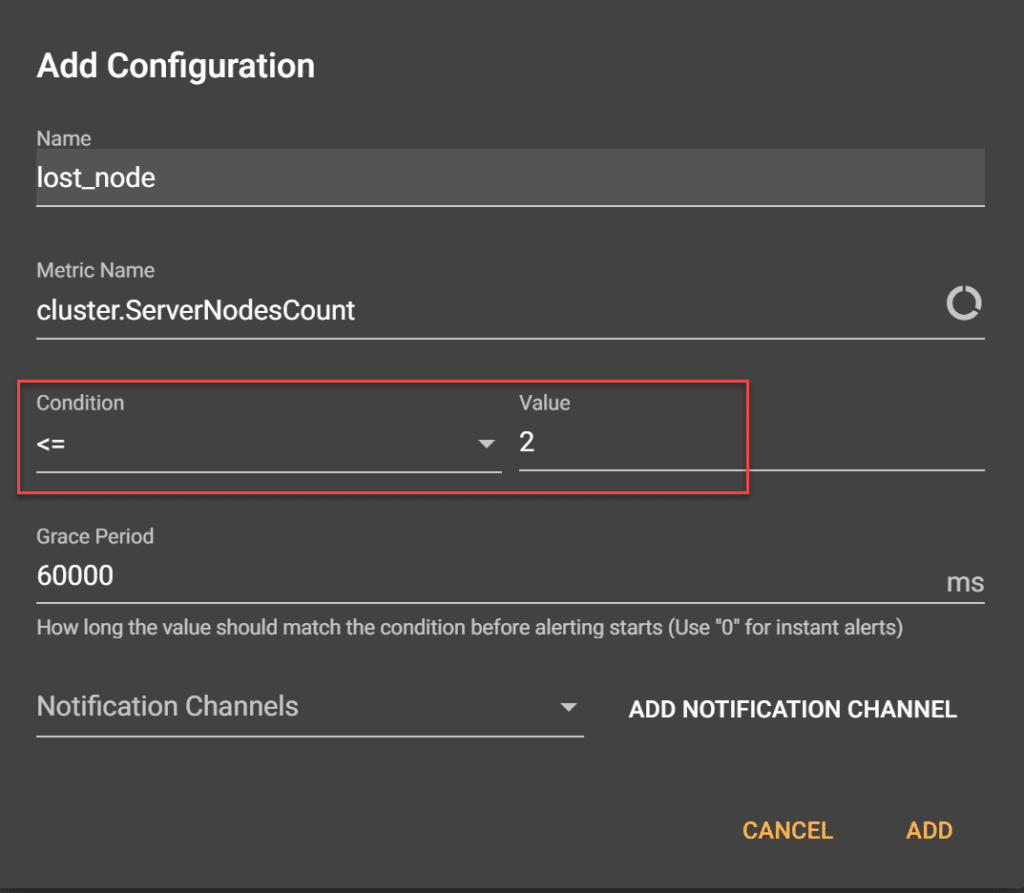
- Condition: This means we get an alert once we have fewer than the set number of nodes. Specify <= with a value of 2.
- Grace Period: This is the length of time before the alert kicks in. The default is 60,000ms. To see immediate alerts, change this value to 0.
- Notification Channels: This is how you’re receiving alerts.
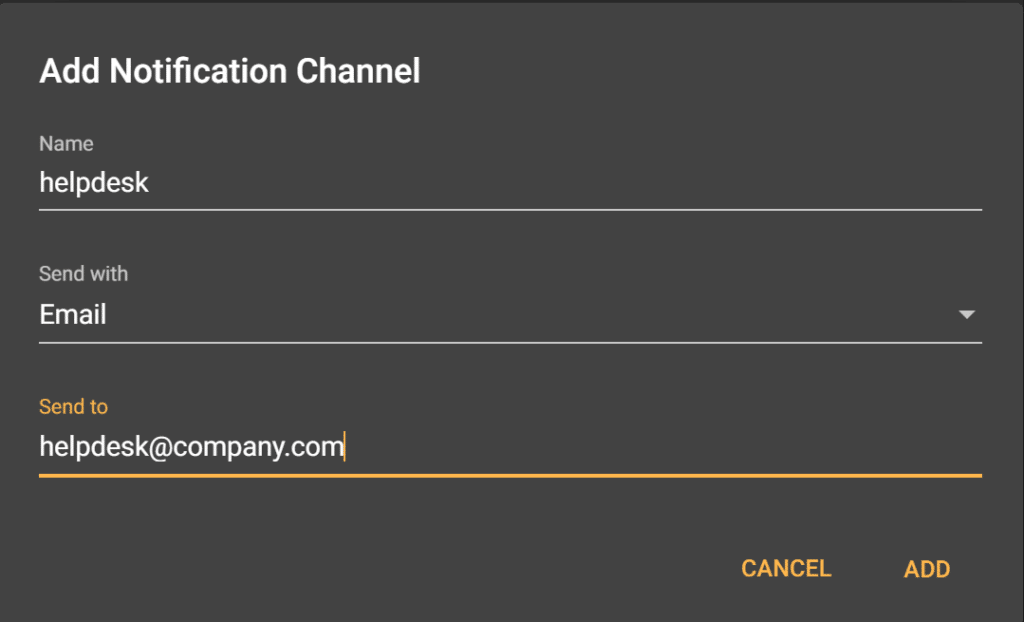
Click Add Notification Channel, select the notification channel type of email, and provide a valid email address. Save the channel setting by giving a name — for example, helpdesk.
The completed Configuration window looks like this now:
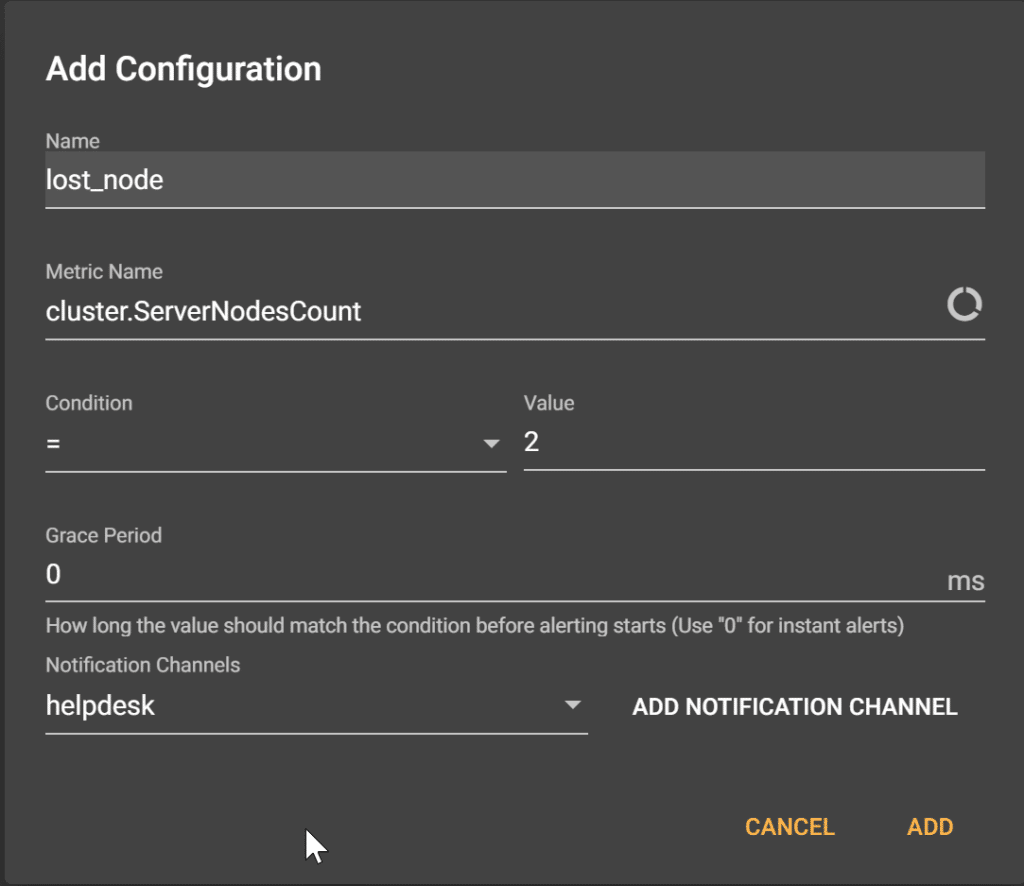
Click Add to save the configuration.
After defining this alert and saving the configuration, you can test the alert configuration by shutting down one of your Ignite nodes. As long as you meet the condition of less than or equal to two, you are fine.
Check the results of the alert condition by clicking the Alerts tab.
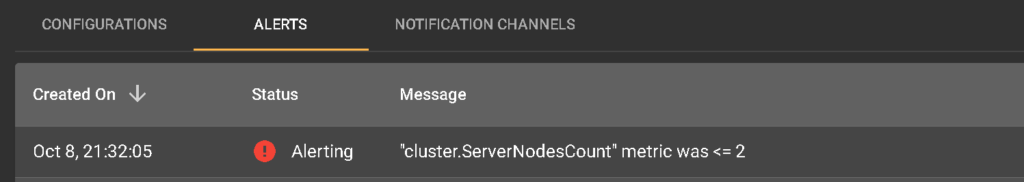
The email message the GridGain Control Center sends summarizes the alert condition.

SQL Optimization
SQL optimization is one of the GridGain Control Center’s most popular and potent features. It helps SQL database admins run SQL scripts, like using SQL Management Studio or the like, directly from within the Control Center.
On the main GridGain page, on the left-side toolbar, click SQL, then select Queries List. Here, you can run any SQL query operation. The sample below creates a new table called Person with two fields, ID and Name, and some corresponding data.
Here’s a sample query:
					CREATE TABLE Person(ID INTEGER PRIMARY KEY, NAME VARCHAR(100));
INSERT INTO Person(ID, NAME) VALUES (1,’Ed’), (2, ‘Ann’), (3, ‘Emma);
SELECT * FROM Person;
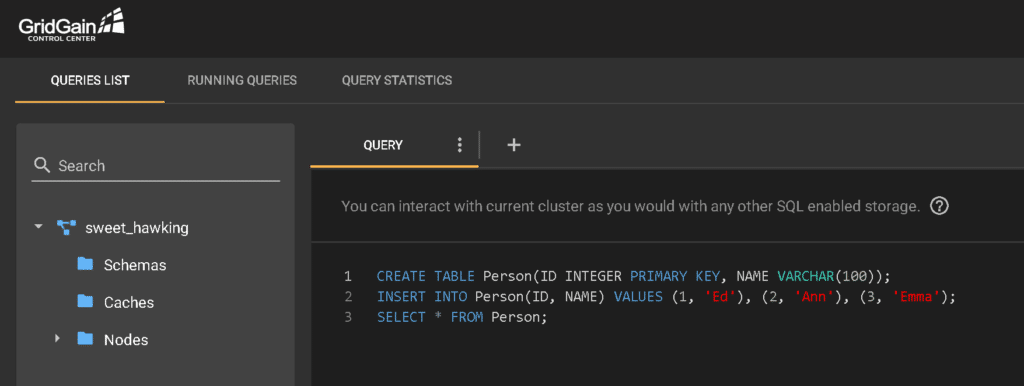
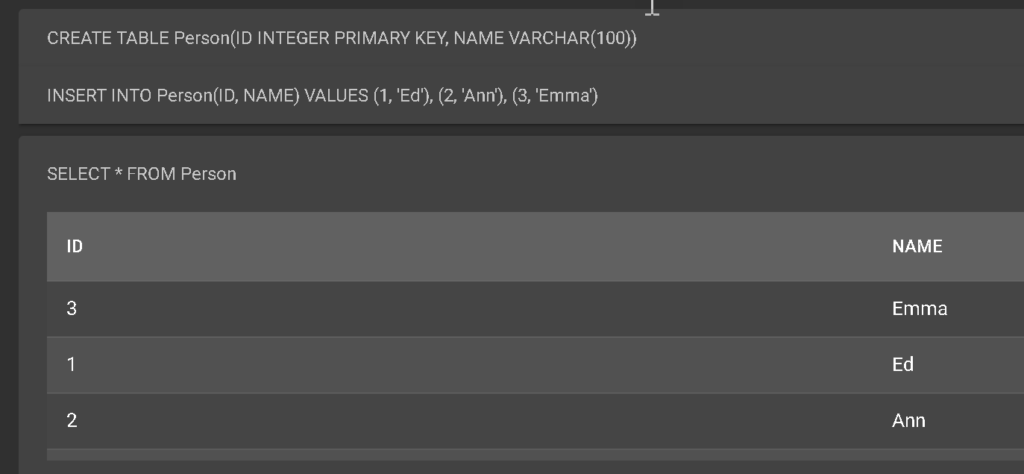
Run this query, and see its output immediately in the resulting table view.
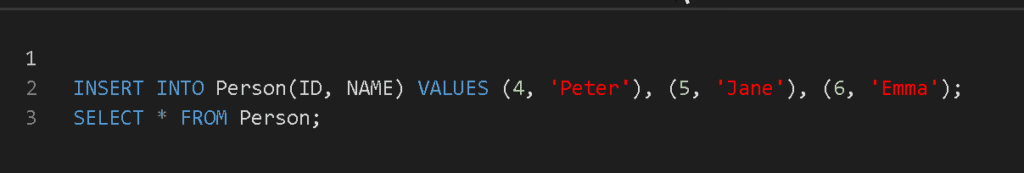
Let’s update the query a little bit to add additional records to the table.
Here’s a sample query to trigger updates:
INSERT INTO Person(ID, NAME) VALUES (4,’Peter’), (5, ‘Jane’), (6, ‘Emma);
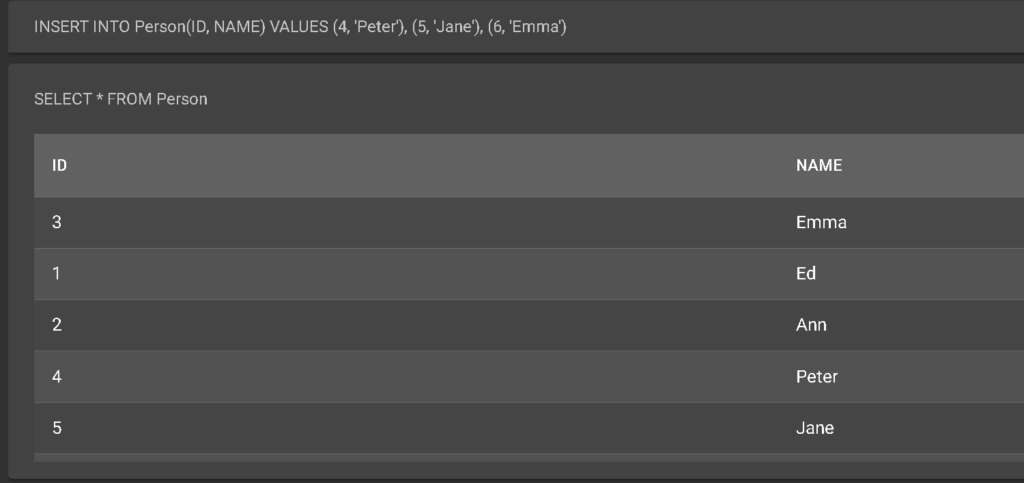
SELECT * FROM Person;
The result looks like this:
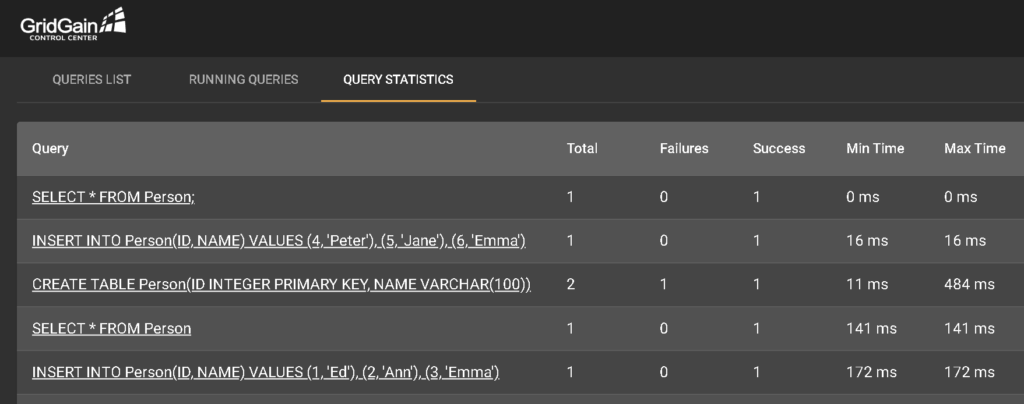
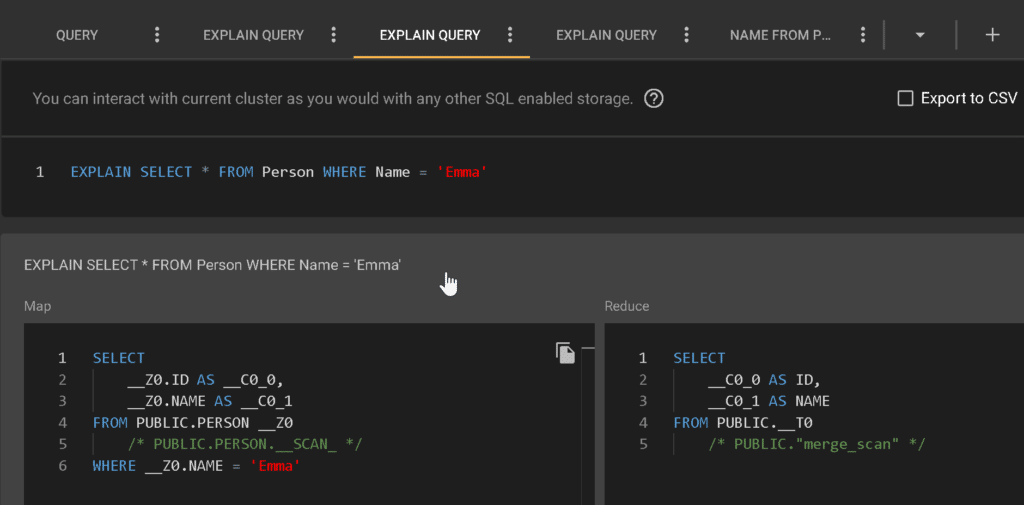
This tab shows a list of the most recent query actions performed. At the right end of a query line, click <…> and select Explain Query. This action opens a new tab that shows the query job’s analytics and details of how the data was composed. For example, run a select query to find all duplicates in the Name column with the value Emma.
Configuring Caches
The Caches blade manages active caches, showing the cache list and providing the name, cache ID, and atomicity. It also shows the cache partitioning in the cluster and any lost partitions. For our sample setup of the two-node cluster, the view shows this: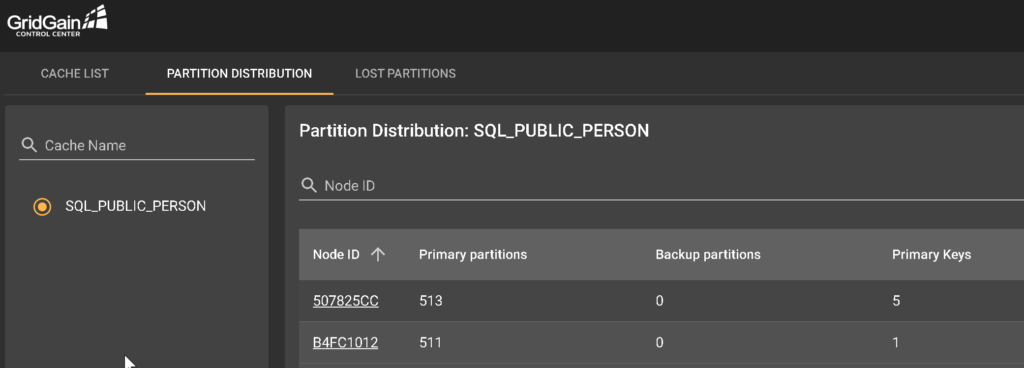
Backup and Recover
This option is available in the GridGain Ultimate Edition by clicking Snapshots in the toolbar on the main page. This feature allows taking snapshots of your GridGain clusters and running restores in case of a disaster. You can see snapshots as traditional diagrams of relational databases to learn more. It’s also possible to restore data in all clusters.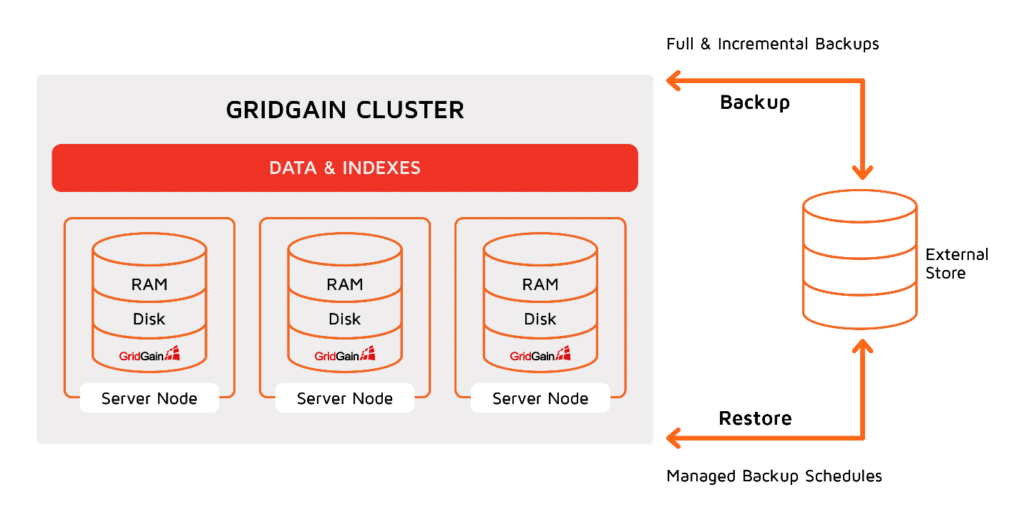
Conclusion
Managing Apache Ignite can be cumbersome without proper tools. GridGain Control Center simplifies Apache Ignite administration, troubleshooting and optimization with a visual interface to your cluster. Its capabilities help systems and database administrators understand Apache Ignite clusters’ health and performance states. It also has powerful, customizable alerting, intelligent SQL query analytics, and detailed node metrics views.
If you’re interested in developing expert technical content that performs, let’s have a conversation today.