Miro’s audit logs help track events within different company teams. This means you’re all set to troubleshoot a problem or get a detailed report of significant events, such as global security setting changes, failed login attempts, new user invitations, app removal, new board creation, or changes to existing boards. Even better, you can call Miro’s REST API endpoint from your web application to retrieve user event logs in a JSON object format. Then, you can display them using your preferred web technology.
In this tutorial, you’ll learn how to build an audit log dashboard using Miro’s audit log API, JavaScript, and Node.js. You can find the complete code for this project on GitHub.
Prerequisites
Before you begin, you should:
- First, create a Miro account if you don’t already have one.
- Be familiar with Node.js to follow along.
- Contact Miro to give you access to the auditlogs:read scope. This allows you to read your organization’s audit logs, which are only available in the enterprise plan. We’ll create a new organization in your Miro account. Your role will be Company Admin, enabling you to manage all teams and other settings on the company level.
Create an App in Miro
- To create an app in your enterprise team’s organization, start by clicking the settings icon (ES) at the top left of the Miro dashboard. This action takes you to your team’s profile page.
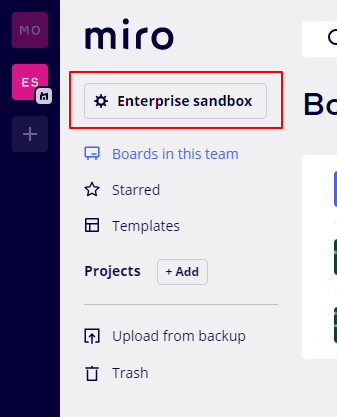
- Then, click Company to go to your company dashboard.
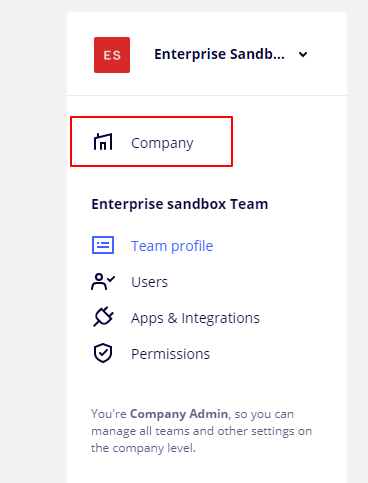
- Next, click Profile settings on the dashboard.
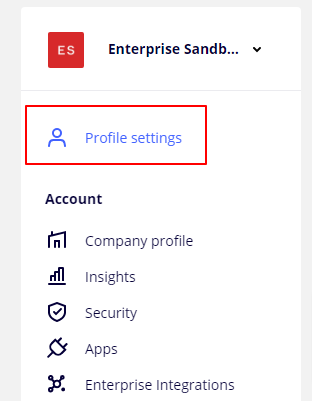
- On the Profile settings page, click Apps.
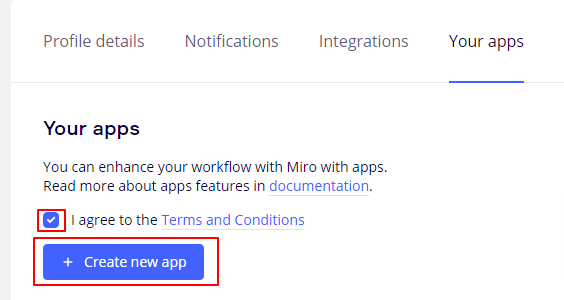
- On the Your apps page, review the Terms and Conditions, select the I agree to the Terms and Conditions checkbox, then click Create new app.
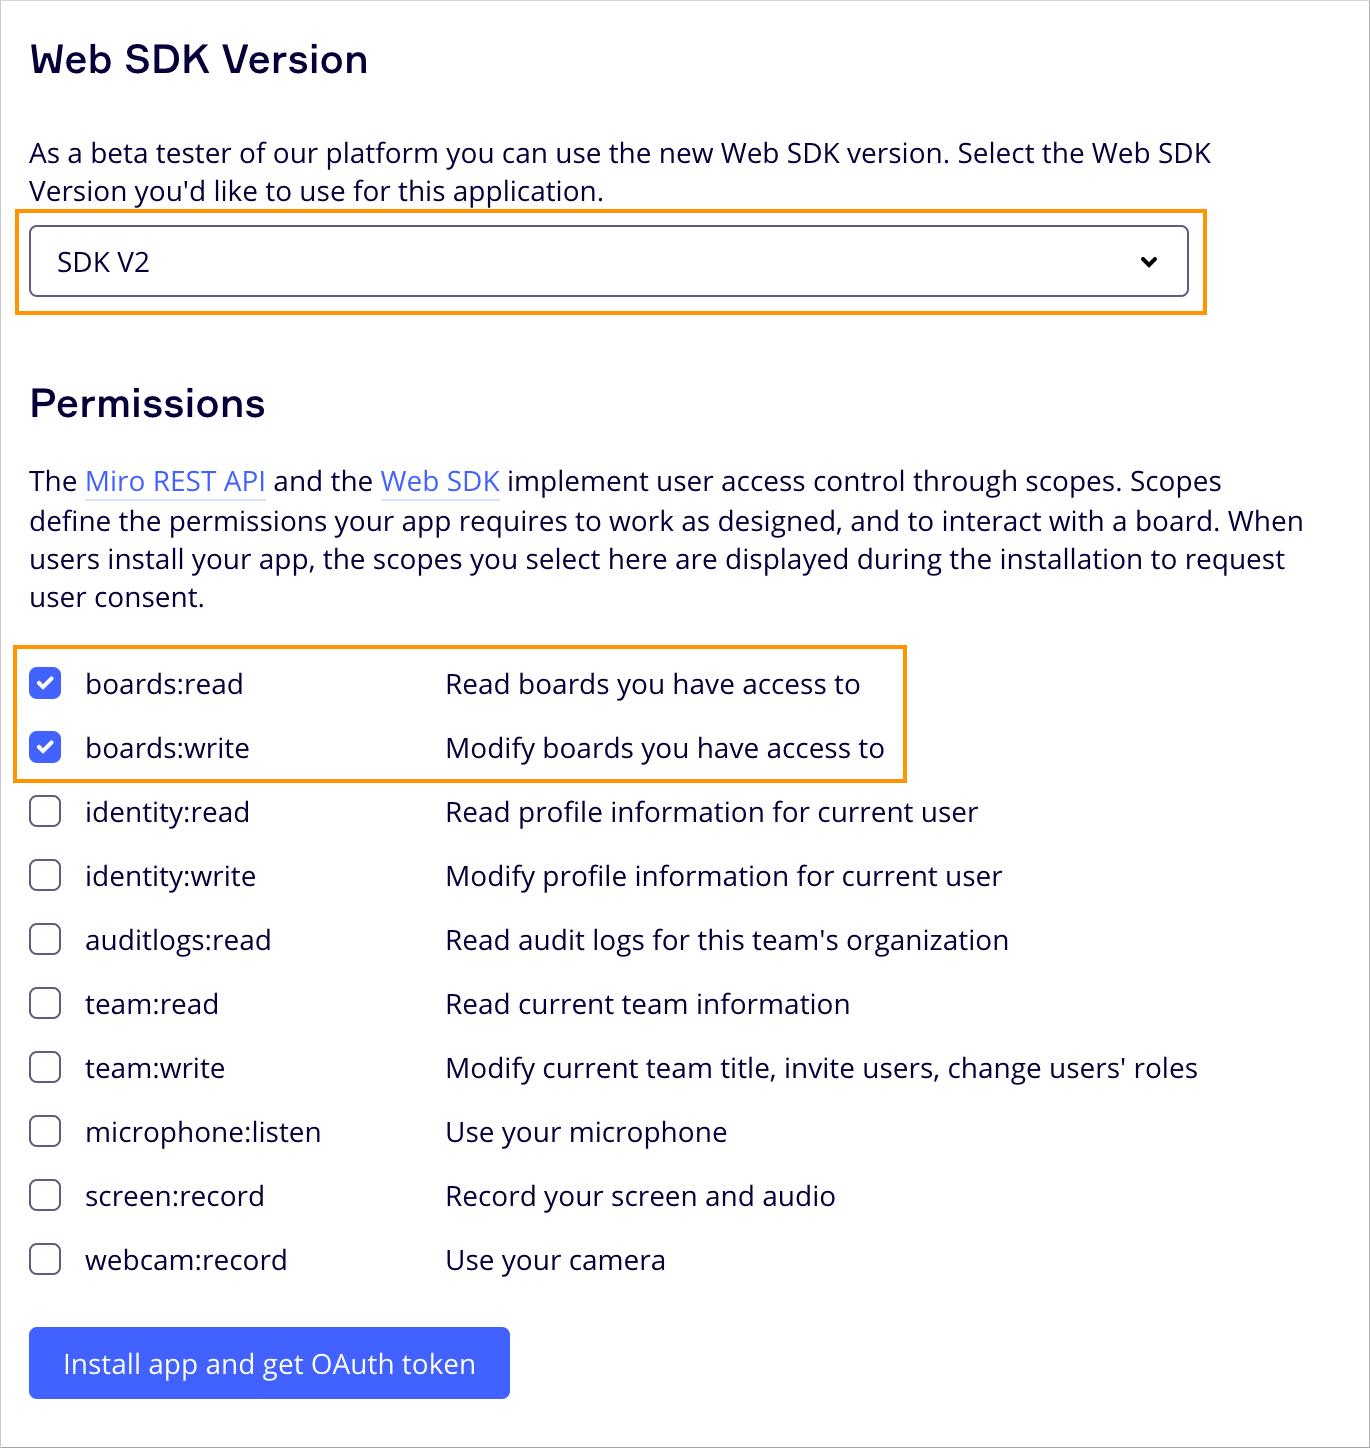
- In the Web SDK dialog box, select SDK V2 from the list of SDK versions (Figure 5).
- Under Permissions, select the boards:read and the boards:write checkboxes (Figure 5).
- Click Install app and get OAuth token.
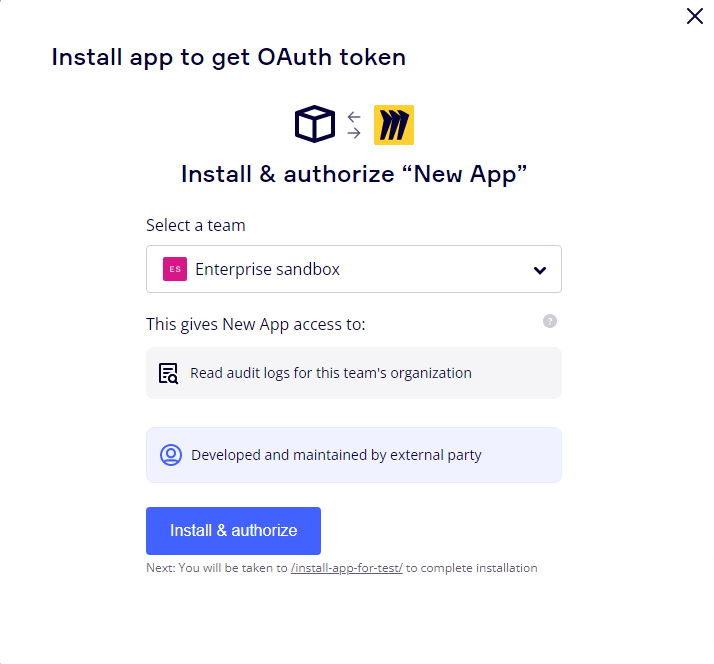
- Select your enterprise team and click Install & authorize in the resulting popup.
Figure 6 shows that the new app has permission to read audit logs for the team’s organization. You see your OAuth access token after installation.
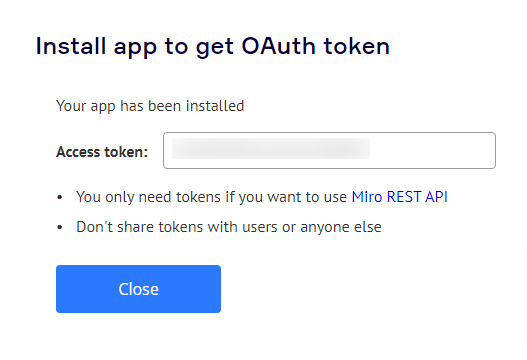
Keep this token. You need it later to make API calls and retrieve the audit logs.
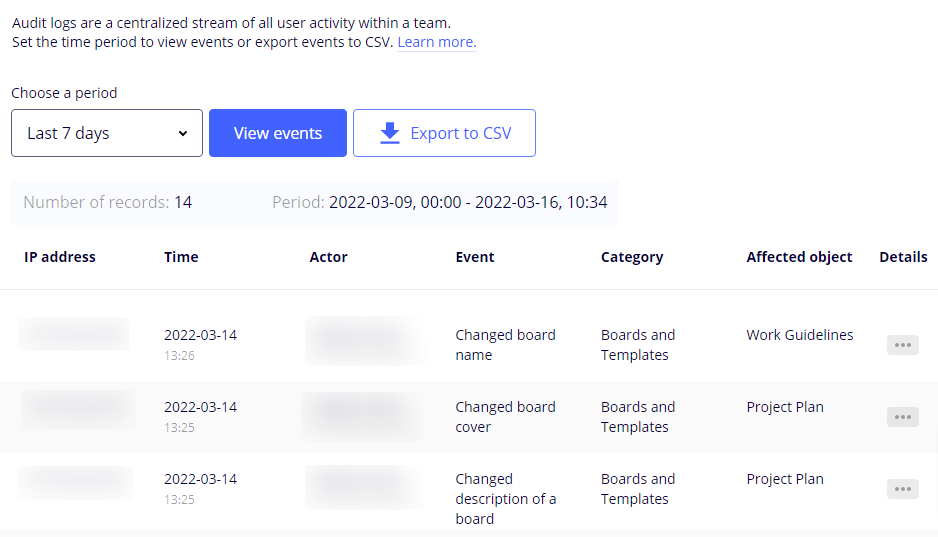
You can view events directly on the dashboard in the Audit logs section.
- Click your profile avatar > Settings > Profile settings > Audit logs to reach this option.
- Select a period and click View events.
Build the Dashboard to Display User Events
Whenever a team member performs a notable task in your organization, their action registers an event. As a company admin, you’ve likely triggered these six events in your app so far:-
board_createdboard_openedboard_account_sharing_enabledboard_name_changedboard_descByer_changed
- Install the Vue CLI globally (if you haven’t already done so) using this command:
npm install -g @vue/cli
- Create a new Vue application using this command:
vue create miro-logs
After a while, Vue should generate your new application.
- When it’s finished, change to the miro-logs directory:
cd into miro-logs
- Start your app by running:
vue serve.
- Copy the CDN link to Tailwind CSS into your public/index.html file:
<link rel="stylesheet" href="https://cdnjs.cloudflare.com/ajax/libs/tailwindcss/2.2.19/tailwind.min.css" integrity="sha512-wnea99uKIC3TJF7v4eKk4Y+lMz2Mklv18+r4na2Gn1abDRPPOeef95xTzdwGD9e6zXJBteMIhZ1+68QC5byJZw==" crossorigin="anonymous" referrerpolicy="no-referrer" />
- In App.vue, replace the contents of your
<script>tag with the following code. Delete the components folder, as you don’t need it.
					export default {
  name: 'App',
  data() {
    return {
      results: []
    }
  },
  mounted() {
    const options = {
      method: 'GET',
      headers: {
        Accept: 'application/json',
        Authorization: 'Bearer <your-access-token>'
      }
    };

    fetch('http://localhost:8010/proxy/v1/audit/logs?createdAfter=2022-03-13&createdBefore=2022-03-15&limit=10&offset=1', options)
      .then(response => response.json())
      .then(res=> {
        this.results = res;
        console.log(this.results);
      })
      .catch(err => console.error(err));
  }
}
- Ensure that you replace with your application’s access token. Also,
createdAfterandcreatedBeforedates are both required. Learn more about the logs API in our developer resources.
data() and returns results with an empty array. Later, the API returns audit data to populate this array.
The code also makes a request to the audit logs API by passing the options object using the mounted hook. The options object contains the request method and a request header. The request header contains the content type and the Miro app’s access token.
If you look at the URL you’re using for the request, you see that the URL belongs to a proxy server. This approach eliminates CORS errors. However, you won’t need to do this with an enterprise account. Our team will safelist your domain to directly make requests to https://api.miro.com/v1/audit/logs without any issues, so use this URL in the code above.
- Install the CORS proxy using the following command:
npm i local-cors-proxy
- Add the following script to your package.json file, under
scripts:
"proxy": "lcp --proxyUrl https://api.miro.com"
Pointing to your project root, run the command npm run proxy on your terminal. You should now be able to make API calls to https://api.miro.com via the proxy localhost:8010.
- Next, your app needs to cycle through the data and display them inside your Vue template. Go back to your App.vue file and replace the contents of
with thecontents from this file.
Recall that your app needs to track six events:
Board_name_changedBoard_description_changedBoard_openedBoard_account_sharing_enabledBoard_createdBoard_cover_changed
The full code includes styles for all six events, but let’s focus on the main part of the code:
					<div v-for="event of results.data" :key="event.id">
	<div v-if="event.event == 'board_name_changed'">
	 // Markup for displaying Board Change details
	</div>
	<div v-if="event.event == 'board_description_changed'">
	 // Markup for displaying Board Desc Change details
	</div>
	<div v-if="event.event == 'board_opened'">
	 // Markup for displaying Board Opening details
	</div>
	<div v-if="event.event == 'board_account_sharing_enabled'">
	 // Markup for displaying Board Sharing details
	</div>
	<div v-if="event.event == 'board_created'">
	 // Markup for displaying Board Creation details
	</div>
	<div v-else>
	 // Markup for displaying Board Cover Change details
	</div>
</div>
This code’s goal is simple: It loops through the data that the API returns and passes it into your template. It performs a check to uncover the event type, such as board_opened and board_name_changed, and displays the corresponding template for every event.
At this point, your application should look like Figure 9.
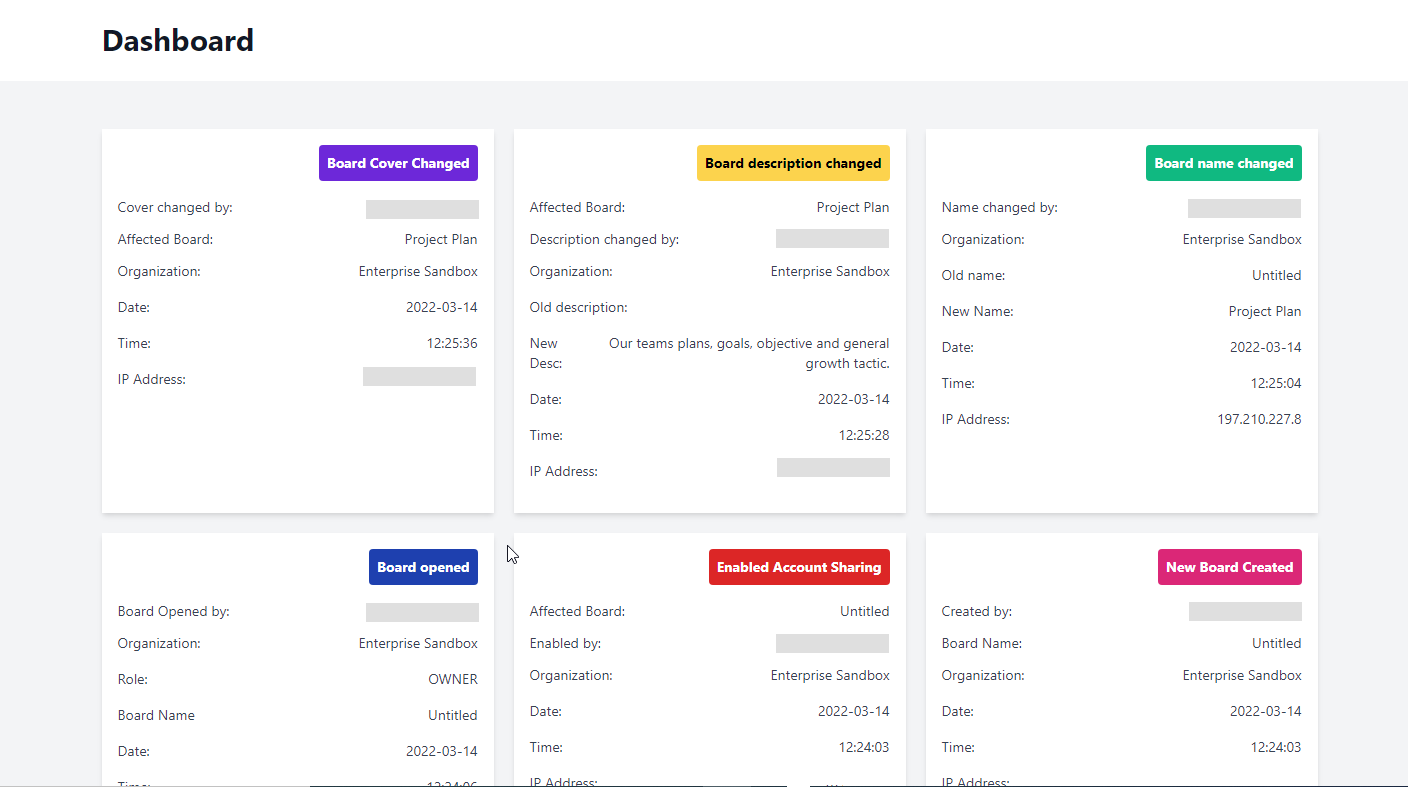
Your dashboard application now provides details about board events so you can track any unusual activity or find areas for improvement.
Visualize Logs using the Miro App and Splunk
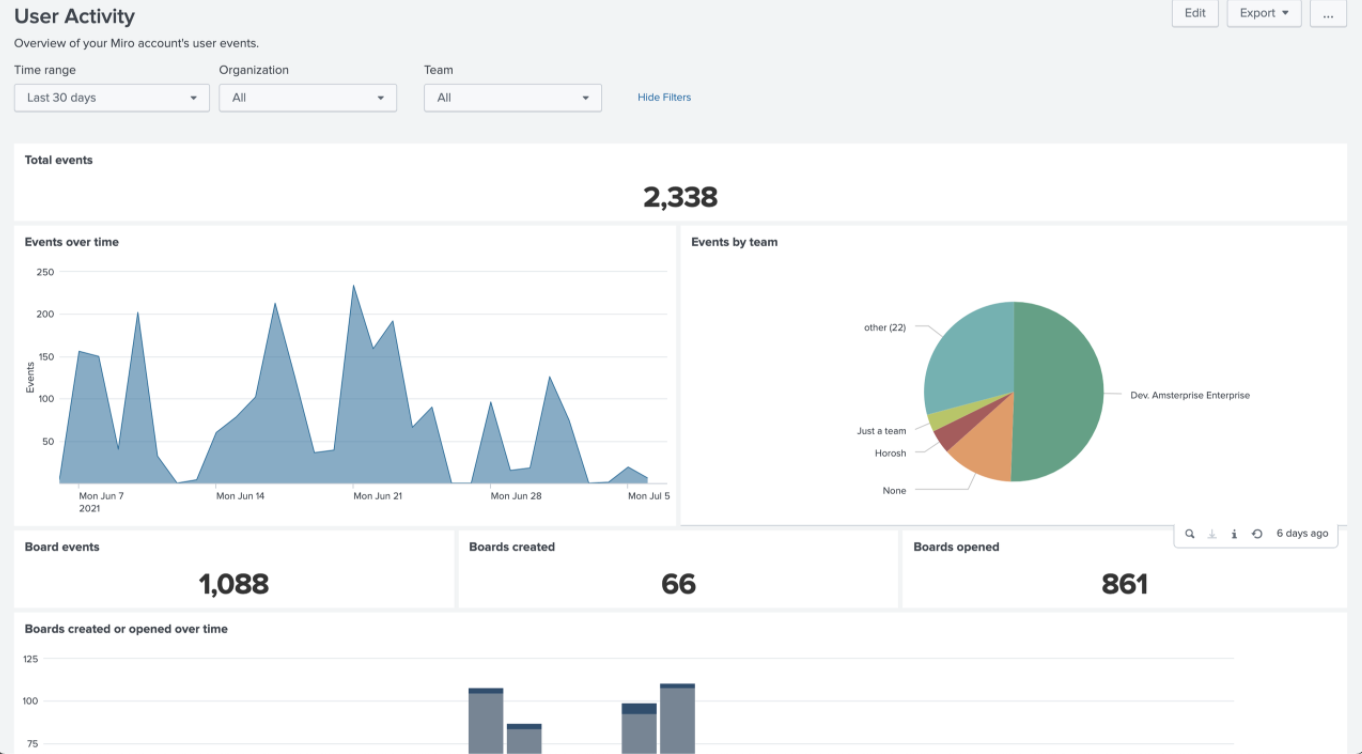
With Miro’s Audit Log API, you can take your data analysis to the next level by connecting to apps that offer additional features, like data visualization and filtering. For example, you can integrate your Miro app with Splunk using this detailed guide.
Splunk’s data visualization tool provides an overview of all user events in your Miro accounts. You can see information like the number of events over time, organized by team and total, and board events like boards created and boards opened.
Additionally, you get a visual overview of your Miro account’s security activity, including the number of successful and failed sign-ins. You also get the list of user events when sharing boards.
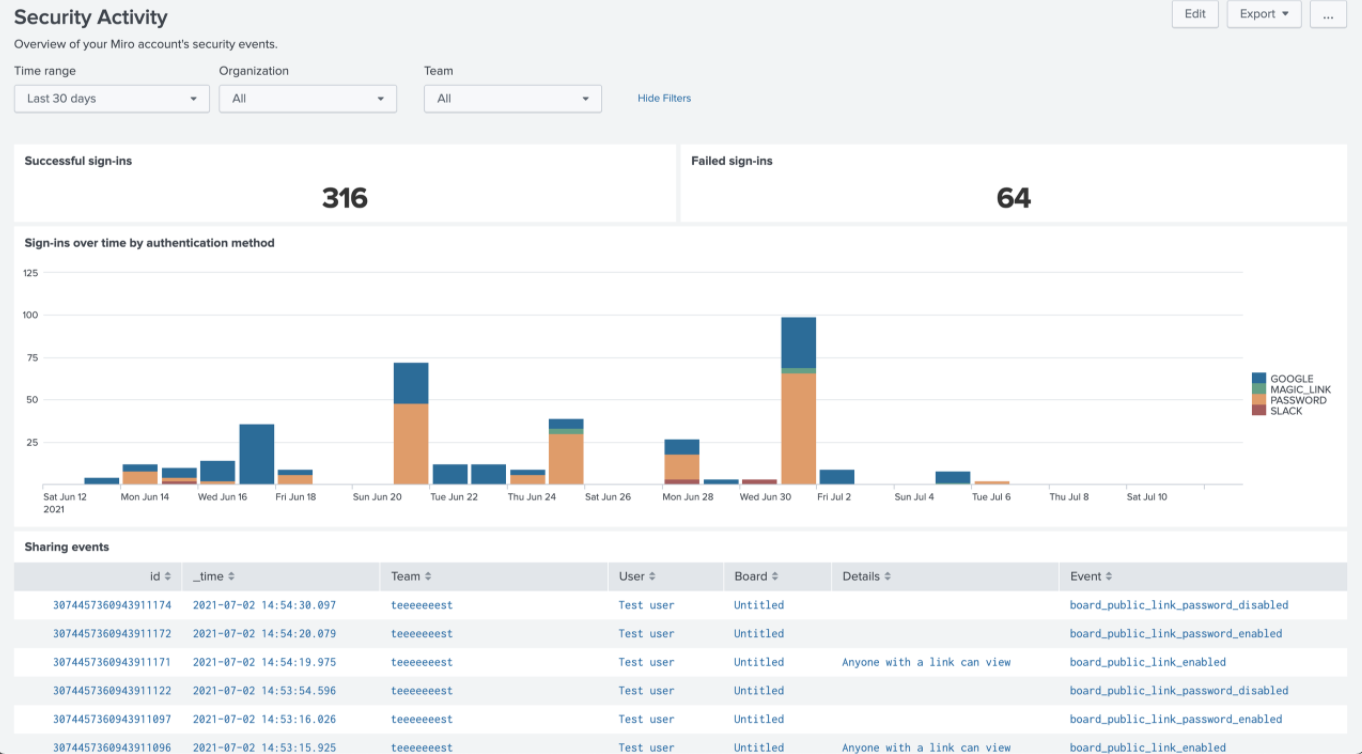
You can also filter by organizations, teams, and periods.
Next Steps
You now know how to set up an enterprise team in Miro, create an App in the team, and get the OAuth access token from the dashboard for API calls. You can build a sleek dashboard application with Vue or any preferred language or framework.
You can use the access token to access your audit log data over the API, then display the information in templates. Finally, you can take your audit analysis to the next level by integrating Miro with Splunk.
Now that you know how to set up and use audit logs, you can better understand how your organization uses Miro and protect your company’s information.
If you’re interested in developing expert technical content that performs, let’s have a conversation today.


